Competitor Analysis: Evaluating Amazon.com And Competitors In Broadline Retail Industry
Author: Benzinga Insights | November 11, 2025 10:01am
In the dynamic and fiercely competitive business environment, conducting a thorough analysis of companies is crucial for investors and industry enthusiasts. In this article, we will perform an extensive industry comparison, evaluating Amazon.com (NASDAQ:AMZN) in relation to its major competitors in the Broadline Retail industry. By closely examining crucial financial metrics, market position, and growth prospects, we aim to offer valuable insights for investors and shed light on company's performance within the industry.
Amazon.com Background
Amazon is the leading online retailer and marketplace for third party sellers. Retail related revenue represents approximately 74% of total, followed by Amazon Web Services (17%), and advertising services (9%). International segments constitute 22% of Amazon's total revenue, led by Germany, the United Kingdom, and Japan.
| Company |
P/E |
P/B |
P/S |
ROE |
EBITDA (in billions) |
Gross Profit (in billions) |
Revenue Growth |
| Amazon.com Inc |
35.08 |
7.18 |
3.88 |
6.02% |
$45.5 |
$91.5 |
13.4% |
| Alibaba Group Holding Ltd |
19.15 |
2.78 |
2.83 |
4.26% |
$53.52 |
$111.22 |
1.82% |
| PDD Holdings Inc |
14.87 |
3.86 |
3.56 |
8.89% |
$25.79 |
$58.13 |
7.14% |
| MercadoLibre Inc |
51.06 |
17.06 |
4.05 |
7.06% |
$0.88 |
$3.21 |
39.48% |
| Sea Ltd |
79.92 |
9.49 |
4.98 |
4.36% |
$0.58 |
$2.41 |
38.16% |
| Coupang Inc |
137.71 |
11.14 |
1.61 |
2.02% |
$0.32 |
$2.72 |
17.81% |
| JD.com Inc |
8.76 |
1.40 |
0.27 |
2.68% |
$7.34 |
$56.64 |
22.4% |
| eBay Inc |
18.89 |
8.16 |
3.77 |
13.35% |
$0.74 |
$2.0 |
9.47% |
| Vipshop Holdings Ltd |
10.53 |
1.75 |
0.69 |
3.74% |
$1.91 |
$6.05 |
-3.98% |
| Dillard's Inc |
16.85 |
4.96 |
1.47 |
3.86% |
$0.14 |
$0.58 |
1.41% |
| Ollie's Bargain Outlet Holdings Inc |
36.67 |
4.34 |
3.20 |
3.49% |
$0.09 |
$0.27 |
17.49% |
| MINISO Group Holding Ltd |
20.46 |
4.34 |
2.58 |
4.56% |
$0.73 |
$2.2 |
23.07% |
| Macy's Inc |
11.69 |
1.24 |
0.25 |
1.95% |
$0.36 |
$2.1 |
-1.9% |
| Kohl's Corp |
9.63 |
0.51 |
0.13 |
3.97% |
$0.45 |
$1.53 |
-4.98% |
| Hour Loop Inc |
65 |
9.58 |
0.50 |
18.14% |
$0.0 |
$0.02 |
-3.45% |
| Average |
35.8 |
5.76 |
2.13 |
5.88% |
$6.63 |
$17.79 |
11.71% |
By conducting a comprehensive analysis of Amazon.com, the following trends become evident:
-
With a Price to Earnings ratio of 35.08, which is 0.98x less than the industry average, the stock shows potential for growth at a reasonable price, making it an interesting consideration for market participants.
-
With a Price to Book ratio of 7.18, which is 1.25x the industry average, Amazon.com might be considered overvalued in terms of its book value, as it is trading at a higher multiple compared to its industry peers.
-
With a relatively high Price to Sales ratio of 3.88, which is 1.82x the industry average, the stock might be considered overvalued based on sales performance.
-
The Return on Equity (ROE) of 6.02% is 0.14% above the industry average, highlighting efficient use of equity to generate profits.
-
With higher Earnings Before Interest, Taxes, Depreciation, and Amortization (EBITDA) of $45.5 Billion, which is 6.86x above the industry average, the company demonstrates stronger profitability and robust cash flow generation.
-
Compared to its industry, the company has higher gross profit of $91.5 Billion, which indicates 5.14x above the industry average, indicating stronger profitability and higher earnings from its core operations.
-
The company's revenue growth of 13.4% exceeds the industry average of 11.71%, indicating strong sales performance and market outperformance.
Debt To Equity Ratio
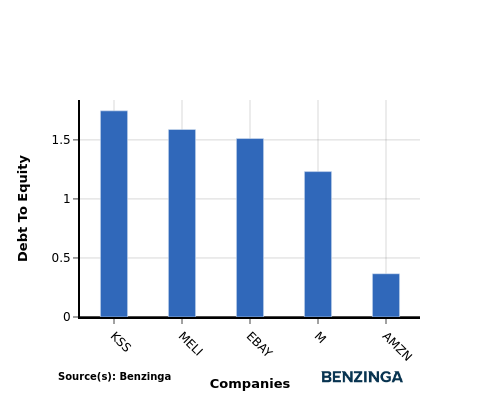
The debt-to-equity (D/E) ratio is an important measure to assess the financial structure and risk profile of a company.
Considering the debt-to-equity ratio in industry comparisons allows for a concise evaluation of a company's financial health and risk profile, aiding in informed decision-making.
When examining Amazon.com in comparison to its top 4 peers with respect to the Debt-to-Equity ratio, the following information becomes apparent:
-
Among its top 4 peers, Amazon.com has a stronger financial position with a lower debt-to-equity ratio of 0.37.
-
This indicates that the company relies less on debt financing and maintains a more favorable balance between debt and equity, which can be viewed positively by investors.
Key Takeaways
For Amazon.com, the PE ratio is low compared to its peers in the Broadline Retail industry, indicating potential undervaluation. The high PB and PS ratios suggest that the market values Amazon.com's assets and sales highly. In terms of ROE, EBITDA, gross profit, and revenue growth, Amazon.com outperforms its industry peers, reflecting strong financial performance and growth potential.
This article was generated by Benzinga's automated content engine and reviewed by an editor.
Posted In: AMZN