Assessing Microsoft's Performance Against Competitors In Software Industry
Author: Benzinga Insights | November 03, 2025 10:00am
In today's rapidly changing and highly competitive business world, it is imperative for investors and industry observers to carefully assess companies before making investment choices. In this article, we will undertake a comprehensive industry comparison, evaluating Microsoft (NASDAQ:MSFT) vis-à-vis its key competitors in the Software industry. Through a detailed analysis of important financial indicators, market standing, and growth potential, our goal is to provide valuable insights and highlight company's performance in the industry.
Microsoft Background
Microsoft develops and licenses consumer and enterprise software. It is known for its Windows operating systems and Office productivity suite. The company is organized into three equally sized broad segments: productivity and business processes (legacy Microsoft Office, cloud-based Office 365, Exchange, SharePoint, Skype, LinkedIn, Dynamics), intelligence cloud (infrastructure- and platform-as-a-service offerings Azure, Windows Server OS, SQL Server), and more personal computing (Windows Client, Xbox, Bing search, display advertising, and Surface laptops, tablets, and desktops).
| Company |
P/E |
P/B |
P/S |
ROE |
EBITDA (in billions) |
Gross Profit (in billions) |
Revenue Growth |
| Microsoft Corp |
36.83 |
10.60 |
13.15 |
7.85% |
$48.06 |
$53.63 |
18.43% |
| Oracle Corp |
60.79 |
30.99 |
12.82 |
13.12% |
$6.12 |
$10.04 |
12.17% |
| ServiceNow Inc |
111.16 |
16.93 |
15.20 |
4.52% |
$0.89 |
$2.63 |
21.81% |
| Palo Alto Networks Inc |
137.65 |
19.05 |
16.94 |
3.37% |
$0.68 |
$1.86 |
15.84% |
| Fortinet Inc |
34.43 |
32.14 |
10.56 |
21.88% |
$0.56 |
$1.32 |
13.64% |
| Nebius Group NV |
169.90 |
8.70 |
118.97 |
16.85% |
$0.61 |
$0.08 |
594.48% |
| Gen Digital Inc |
27.46 |
6.86 |
3.89 |
5.83% |
$0.58 |
$0.99 |
30.26% |
| Monday.Com Ltd |
270.05 |
8.87 |
9.88 |
0.14% |
$-0.01 |
$0.27 |
26.64% |
| UiPath Inc |
528.67 |
5.06 |
5.79 |
0.09% |
$-0.02 |
$0.3 |
14.38% |
| Dolby Laboratories Inc |
24.47 |
2.44 |
4.80 |
1.78% |
$0.07 |
$0.27 |
9.25% |
| CommVault Systems Inc |
79.12 |
29.17 |
5.75 |
5.12% |
$0.02 |
$0.22 |
18.39% |
| Qualys Inc |
24.55 |
8.76 |
7.14 |
9.4% |
$0.06 |
$0.14 |
10.32% |
| BlackBerry Ltd |
122 |
3.97 |
5.42 |
1.83% |
$0.02 |
$0.1 |
2.69% |
| Average |
132.52 |
14.41 |
18.1 |
6.99% |
$0.8 |
$1.52 |
64.16% |
When closely examining Microsoft, the following trends emerge:
-
With a Price to Earnings ratio of 36.83, which is 0.28x less than the industry average, the stock shows potential for growth at a reasonable price, making it an interesting consideration for market participants.
-
Considering a Price to Book ratio of 10.6, which is well below the industry average by 0.74x, the stock may be undervalued based on its book value compared to its peers.
-
Based on its sales performance, the stock could be deemed undervalued with a Price to Sales ratio of 13.15, which is 0.73x the industry average.
-
The Return on Equity (ROE) of 7.85% is 0.86% above the industry average, highlighting efficient use of equity to generate profits.
-
The Earnings Before Interest, Taxes, Depreciation, and Amortization (EBITDA) of $48.06 Billion is 60.08x above the industry average, highlighting stronger profitability and robust cash flow generation.
-
With higher gross profit of $53.63 Billion, which indicates 35.28x above the industry average, the company demonstrates stronger profitability and higher earnings from its core operations.
-
With a revenue growth of 18.43%, which is much lower than the industry average of 64.16%, the company is experiencing a notable slowdown in sales expansion.
Debt To Equity Ratio
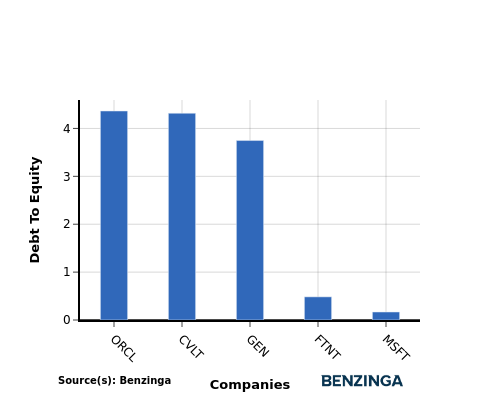
The debt-to-equity (D/E) ratio is an important measure to assess the financial structure and risk profile of a company.
Considering the debt-to-equity ratio in industry comparisons allows for a concise evaluation of a company's financial health and risk profile, aiding in informed decision-making.
By analyzing Microsoft in relation to its top 4 peers based on the Debt-to-Equity ratio, the following insights can be derived:
-
In terms of the debt-to-equity ratio, Microsoft has a lower level of debt compared to its top 4 peers, indicating a stronger financial position.
-
This implies that the company relies less on debt financing and has a more favorable balance between debt and equity with a lower debt-to-equity ratio of 0.17.
Key Takeaways
For Microsoft in the Software industry, the PE, PB, and PS ratios are all low compared to peers, indicating potential undervaluation. On the other hand, Microsoft's high ROE, EBITDA, and gross profit suggest strong profitability and operational efficiency. However, the low revenue growth rate may be a concern compared to industry peers.
This article was generated by Benzinga's automated content engine and reviewed by an editor.
Posted In: MSFT


