Has my stock been accused of fraud?Join over 160k users who know.

Ticker Price Change($) Change(%) Shares Volume Prev Close Open Gain($) Gain(%)
Ticker Status Jurisdiction Filing Date CP Start CP End CP Loss Deadline
Ticker Case Name Status CP Start CP End Deadline Settlement Amt
Ticker Name Date Analyst Firm Up/Down Target ($) Rating Change Rating Current

News

MSTR Up 2% As Strategy Buys 390 Bitcoin, But Downtrend Remains Intact

Author: Parshwa Turakhiya | October 27, 2025 11:20am

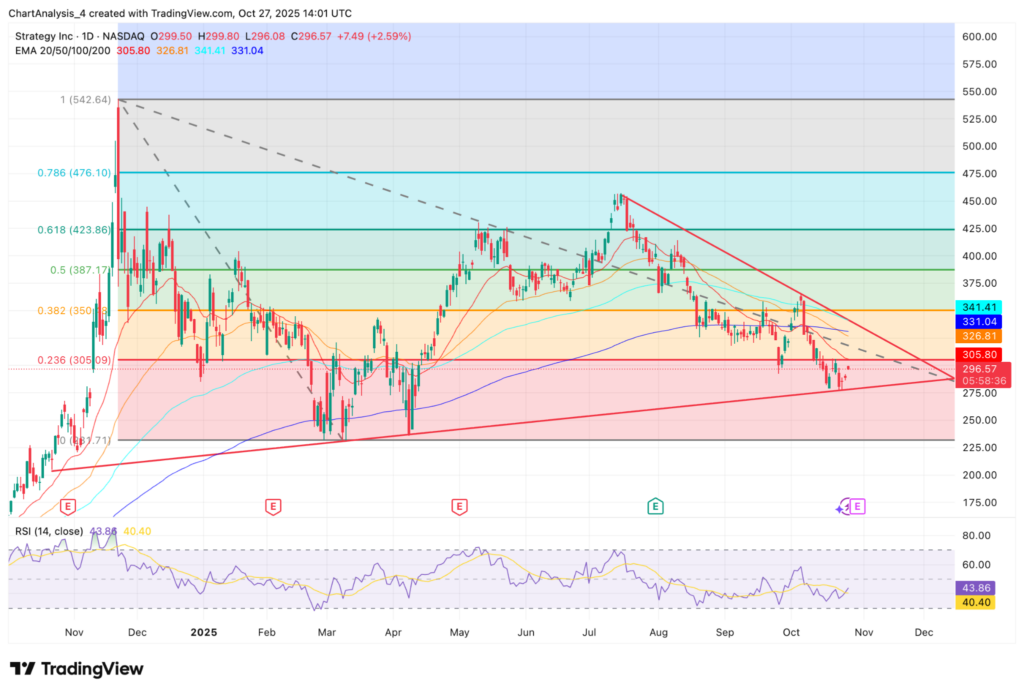
Strategy Inc. (NASDAQ:MSTR) traded near $296 on Monday afternoon, up 2.6%, after the company disclosed a new Bitcoin (CRYPTO: BTC) purchase worth $43.4 million.

Strategy Adds 390 BTC Worth $43 Million

The company announced in its latest SEC Form 8-K filing that it acquired 390 Bitcoin between Oct. 20 and 26 for roughly $43.4 million, at an average price of $111,053 per coin.

As of Oct. 26, Strategy holds 640,808 BTC, purchased for about $47.44 billion at an average cost of $74,032 per coin. 

The firm said proceeds from several preferred stock at-the-market programs funded the latest acquisition.

Strategy reported a 26% Bitcoin yield year-to-date in 2025, underscoring its leveraged exposure to the cryptocurrency's performance. 

The company's Bitcoin dashboard continues to serve as a public disclosure channel for holdings and purchase activity.

Triangle Compression Signals Critical Break Zone

MSTR Price Action (Source: TradingView)

MSTR shares remain locked inside a descending triangle pattern on the daily chart. 

Price has been repeatedly capped by a falling trendline since summer, while the base near $285 has acted as the key floor.

The 20-day EMA near $305, the 50-day EMA at $327, and the 200-day EMA around $341 create a dense resistance cluster. 

Traders view $305–$310 as the first signal zone for a bullish reversal if buyers can regain control.

Failure to defend the $285 level, however, could accelerate losses toward $265, with deeper downside potential at $240 if momentum fades.

Weak RSI, Heavy Overhead Pressure

The RSI sits near 43, showing muted conviction. 

Momentum has improved slightly, but confirmation from buyers is still lacking. 

Trading volume also reflects hesitation ahead of a potential breakout.

The pattern has tightened considerably, signaling that volatility could expand once the stock escapes its current range.

Read Next:

Image: Shutterstock

Posted In: $BTC MSTR

CLASS ACTION DEADLINES - JOIN NOW!

NEW CASE INVESTIGATION

CORE Finalist