Earnings Outlook For Liberty Energy
Author: Benzinga Insights | October 15, 2025 12:00pm
Liberty Energy (NYSE:LBRT) is set to give its latest quarterly earnings report on Thursday, 2025-10-16. Here's what investors need to know before the announcement.
Analysts estimate that Liberty Energy will report an earnings per share (EPS) of $-0.05.
Liberty Energy bulls will hope to hear the company announce they've not only beaten that estimate, but also to provide positive guidance, or forecasted growth, for the next quarter.
New investors should note that it is sometimes not an earnings beat or miss that most affects the price of a stock, but the guidance (or forecast).
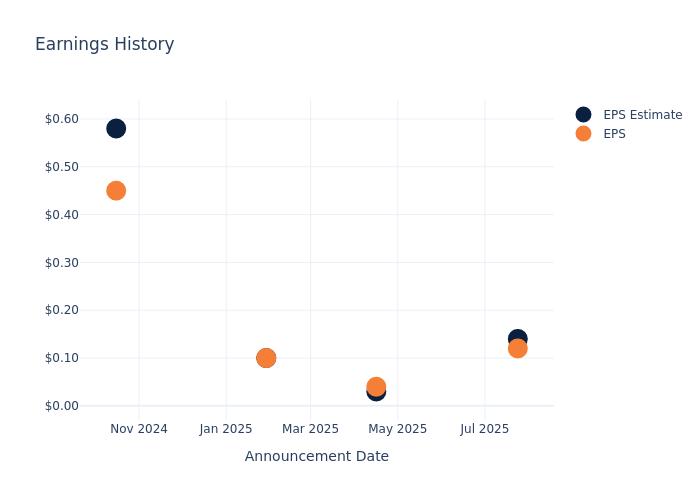
Overview of Past Earnings
During the last quarter, the company reported an EPS missed by $0.02, leading to a 1.39% increase in the share price on the subsequent day.
Here's a look at Liberty Energy's past performance and the resulting price change:
| Quarter |
Q2 2025 |
Q1 2025 |
Q4 2024 |
Q3 2024 |
| EPS Estimate |
0.14 |
0.03 |
0.1 |
0.58 |
| EPS Actual |
0.12 |
0.04 |
0.1 |
0.45 |
| Price Change % |
1.00% |
6.00% |
-7.00% |
-9.00% |
Liberty Energy Share Price Analysis
Shares of Liberty Energy were trading at $12.26 as of October 14. Over the last 52-week period, shares are down 31.72%. Given that these returns are generally negative, long-term shareholders are likely upset going into this earnings release.
Analysts' Take on Liberty Energy
For investors, staying informed about market sentiments and expectations in the industry is paramount. This analysis provides an exploration of the latest insights on Liberty Energy.
Liberty Energy has received a total of 4 ratings from analysts, with the consensus rating as Neutral. With an average one-year price target of $14.5, the consensus suggests a potential 18.27% upside.
Peer Ratings Overview
The below comparison of the analyst ratings and average 1-year price targets of Oceaneering International, Cactus and Tidewater, three prominent players in the industry, gives insights for their relative performance expectations and market positioning.
- Analysts currently favor an Neutral trajectory for Oceaneering International, with an average 1-year price target of $23.5, suggesting a potential 91.68% upside.
- Analysts currently favor an Buy trajectory for Cactus, with an average 1-year price target of $52.5, suggesting a potential 328.22% upside.
- Analysts currently favor an Neutral trajectory for Tidewater, with an average 1-year price target of $67.0, suggesting a potential 446.49% upside.
Analysis Summary for Peers
In the peer analysis summary, key metrics for Oceaneering International, Cactus and Tidewater are highlighted, providing an understanding of their respective standings within the industry and offering insights into their market positions and comparative performance.
| Company |
Consensus |
Revenue Growth |
Gross Profit |
Return on Equity |
| Liberty Energy |
Neutral |
-10.12% |
$101.05M |
3.54% |
| Oceaneering International |
Neutral |
4.39% |
$148.43M |
6.74% |
| Cactus |
Buy |
-5.79% |
$100.00M |
3.57% |
| Tidewater |
Neutral |
0.65% |
$106.66M |
6.47% |
Key Takeaway:
Liberty Energy ranks at the bottom for Revenue Growth and Gross Profit, indicating negative growth and lower profit margins compared to its peers. However, it has a higher Return on Equity than some peers, suggesting better efficiency in generating profits relative to shareholder equity. The consensus rating for Liberty Energy is neutral, aligning with the average sentiment towards its peers.
Get to Know Liberty Energy Better
Liberty Energy Inc is a integrated energy services and technology company focused on providing hydraulic fracturing services and related technologies to onshore oil and natural gas exploration and production (E&P) companies. The Company offers customers with hydraulic fracturing services, together with complementary services including wireline services, proppant delivery solutions, field gas processing and treating, compressed natural gas (CNG) delivery, data analytics, related goods (including sand mine operations), and technologies to facilitate lower emission completions, thereby helping customers reduce emissions profile. The company provides services across USA and Canada.
Liberty Energy: Delving into Financials
Market Capitalization Analysis: Below industry benchmarks, the company's market capitalization reflects a smaller scale relative to peers. This could be attributed to factors such as growth expectations or operational capacity.
Negative Revenue Trend: Examining Liberty Energy's financials over 3 months reveals challenges. As of 30 June, 2025, the company experienced a decline of approximately -10.12% in revenue growth, reflecting a decrease in top-line earnings. When compared to others in the Energy sector, the company faces challenges, achieving a growth rate lower than the average among peers.
Net Margin: Liberty Energy's net margin is below industry standards, pointing towards difficulties in achieving strong profitability. With a net margin of 6.81%, the company may encounter challenges in effective cost control.
Return on Equity (ROE): Liberty Energy's ROE stands out, surpassing industry averages. With an impressive ROE of 3.54%, the company demonstrates effective use of equity capital and strong financial performance.
Return on Assets (ROA): Liberty Energy's ROA surpasses industry standards, highlighting the company's exceptional financial performance. With an impressive 2.09% ROA, the company effectively utilizes its assets for optimal returns.
Debt Management: Liberty Energy's debt-to-equity ratio is below industry norms, indicating a sound financial structure with a ratio of 0.25.
To track all earnings releases for Liberty Energy visit their earnings calendar on our site.
This article was generated by Benzinga's automated content engine and reviewed by an editor.
Posted In: LBRT


