Author: Parshwa Turakhiya | October 14, 2025 09:37am
Bitcoin (CRYPTO: BTC) and Ethereum (CRYPTO: ETH) ETFs saw a combined outflow of $755 million, though technical indicators still show resilience, hinting the market may not be as weak as flows suggest.
Bitcoin ETF Outflows Accelerate But BlackRock's IBIT Defies the Trend
According to data from SoSoValue, U.S. Bitcoin ETFs saw combined outflows of $326 million on Oct. 13.
Grayscale's (NYSE:GBTC) recorded redemptions of $145 million, while Fidelity's (BATS:FBTC) and Ark's (S: ARKB) lost $93 million and $211 million, respectively.
BlackRock's (NASDAQ:IBIT) remained the outlier, drawing $60 million in inflows and holding net assets of about $93 billion.
Cumulative inflows for all U.S. Bitcoin ETFs remain above $62.4 billion, showing continued long-term institutional participation despite short-term volatility.
Ethereum ETFs Face $428M Blow As Institutional Support Wavers
On the daily chart, Bitcoindropped to $111,500 after failing to reclaim resistance near $116,000, where the 20-day and 50-day EMAs are aligned.
Despite the decline, Bitcoin continues to respect its ascending trendline from April, with $111,000 acting as a short-term support level and the 200-day EMA near $108,000 serving as a secondary floor.
Unless price closes below $108,000, the larger structure remains intact, keeping the upper projection near $128,000 valid.
The Supertrend indicator shows resistance near $124,500, aligning with the upper channel boundary.
A move above that level would confirm a continuation higher, while a drop below $111,000 would risk a deeper pullback toward the 200-day EMA.
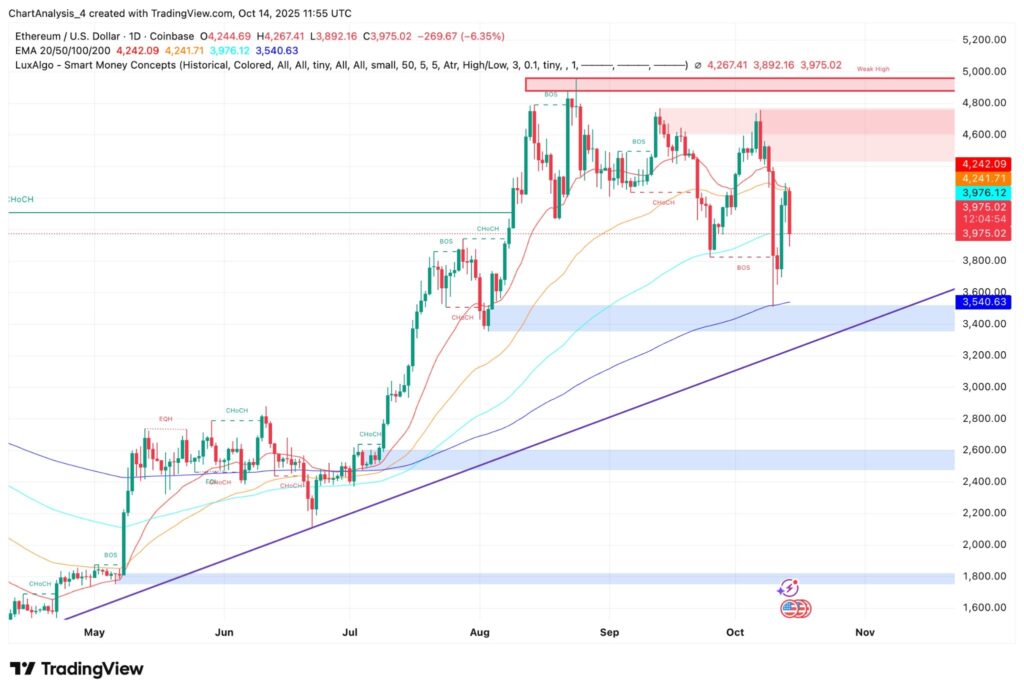
Ethereum Price Defends $3,900 Despite Heavy Redemptions
Ethereum fell to $3,975 after failing to sustain momentum above the $4,600–$4,800 resistance range.
The correction coincided with heavy ETF outflows, intensifying short-term weakness.
Price continues to defend its ascending trendline, with the 200-day EMA near $3,540 marking the critical support for the broader bullish structure.
Momentum indicators show compression rather than breakdown, with the RSI stabilizing and the MACD flattening.
If Ethereum holds above $3,900–$3,600, the setup favors a rebound toward $4,250–$4,600.
A break below $3,540 would invalidate this pattern and expose deeper downside risk toward $3,200.
ETF Outflows Clash With Bullish Chart Patterns In BTC And ETH
Despite the steep ETF outflows, both Bitcoin and Ethereum continue to trade within longer-term bullish formations.
The divergence between institutional flows and technical structure suggests the outflows may reflect short-term repositioning rather than a breakdown in market confidence.
For Bitcoin, maintaining $108,000–$111,000 keeps the path toward $128,000 open.
For Ethereum, staying above $3,600 is essential for any near-term recovery.
The combination of weakening ETF flows and intact trendlines points to a potential sentiment-driven flush rather than a fundamental shift in market positioning.