BlackRock's Earnings Outlook
Author: Benzinga Insights | October 13, 2025 10:01am
BlackRock (NYSE:BLK) is preparing to release its quarterly earnings on Tuesday, 2025-10-14. Here's a brief overview of what investors should keep in mind before the announcement.
Analysts expect BlackRock to report an earnings per share (EPS) of $11.29.
The market awaits BlackRock's announcement, with hopes high for news of surpassing estimates and providing upbeat guidance for the next quarter.
It's important for new investors to understand that guidance can be a significant driver of stock prices.
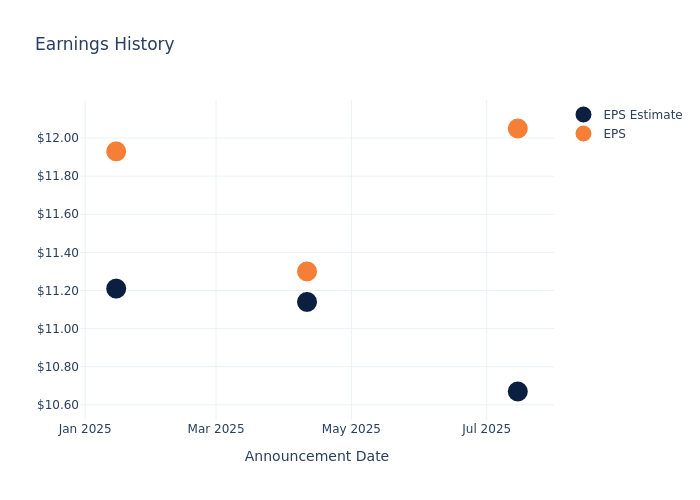
Performance in Previous Earnings
Last quarter the company beat EPS by $1.38, which was followed by a 3.45% increase in the share price the next day.
Here's a look at BlackRock's past performance and the resulting price change:
| Quarter |
Q2 2025 |
Q1 2025 |
Q4 2024 |
Q3 2024 |
| EPS Estimate |
10.67 |
11.14 |
11.21 |
10.38 |
| EPS Actual |
12.05 |
11.30 |
11.93 |
11.46 |
| Price Change % |
3.00% |
2.00% |
-2.00% |
4.00% |
Performance of BlackRock Shares
Shares of BlackRock were trading at $1132.36 as of October 10. Over the last 52-week period, shares are up 14.27%. Given that these returns are generally positive, long-term shareholders are likely bullish going into this earnings release.
Analyst Insights on BlackRock
Understanding market sentiments and expectations within the industry is crucial for investors. This analysis delves into the latest insights on BlackRock.
Analysts have given BlackRock a total of 13 ratings, with the consensus rating being Outperform. The average one-year price target is $1258.92, indicating a potential 11.18% upside.
Analyzing Analyst Ratings Among Peers
In this comparison, we explore the analyst ratings and average 1-year price targets of KKR, Brookfield and Brookfield Asset Mgmt, three prominent industry players, offering insights into their relative performance expectations and market positioning.
- Analysts currently favor an Outperform trajectory for KKR, with an average 1-year price target of $161.25, suggesting a potential 85.76% downside.
- Analysts currently favor an Outperform trajectory for Brookfield, with an average 1-year price target of $79.8, suggesting a potential 92.95% downside.
- Analysts currently favor an Neutral trajectory for Brookfield Asset Mgmt, with an average 1-year price target of $63.04, suggesting a potential 94.43% downside.
Peer Metrics Summary
The peer analysis summary presents essential metrics for KKR, Brookfield and Brookfield Asset Mgmt, unveiling their respective standings within the industry and providing valuable insights into their market positions and comparative performance.
| Company |
Consensus |
Revenue Growth |
Gross Profit |
Return on Equity |
| BlackRock |
Outperform |
12.86% |
$2.60B |
3.28% |
| KKR |
Outperform |
21.78% |
$1.05B |
1.87% |
| Brookfield |
Outperform |
-21.55% |
$4.17B |
0.55% |
| Brookfield Asset Mgmt |
Neutral |
33.91% |
$749M |
7.31% |
Key Takeaway:
BlackRock ranks highest in Gross Profit and Return on Equity among its peers. It is in the middle for Revenue Growth.
Discovering BlackRock: A Closer Look
BlackRock is the largest asset manager in the world, with $12.528 trillion in assets under management at the end of June 2025. Its product mix is diverse, with 54% of managed assets in equity strategies, 25% in fixed income, 8% in multi-asset classes, 8% in money market funds, and 5% in alternatives. Passive strategies account for two-thirds of long-term AUM, with the company's ETF platform maintaining a leading market share domestically and on a global basis. Product distribution is weighted more toward institutional clients, which, by our calculations, account for around 80% of AUM. BlackRock is geographically diverse, with clients in more than 100 countries and more than one-third of managed assets coming from investors domiciled outside the US and Canada.
BlackRock: A Financial Overview
Market Capitalization Analysis: The company's market capitalization surpasses industry averages, showcasing a dominant size relative to peers and suggesting a strong market position.
Positive Revenue Trend: Examining BlackRock's financials over 3 months reveals a positive narrative. The company achieved a noteworthy revenue growth rate of 12.86% as of 30 June, 2025, showcasing a substantial increase in top-line earnings. As compared to its peers, the revenue growth lags behind its industry peers. The company achieved a growth rate lower than the average among peers in Financials sector.
Net Margin: BlackRock's net margin surpasses industry standards, highlighting the company's exceptional financial performance. With an impressive 29.37% net margin, the company effectively manages costs and achieves strong profitability.
Return on Equity (ROE): The company's ROE is a standout performer, exceeding industry averages. With an impressive ROE of 3.28%, the company showcases effective utilization of equity capital.
Return on Assets (ROA): BlackRock's ROA is below industry standards, pointing towards difficulties in efficiently utilizing assets. With an ROA of 1.1%, the company may encounter challenges in delivering satisfactory returns from its assets.
Debt Management: BlackRock's debt-to-equity ratio is below the industry average. With a ratio of 0.3, the company relies less on debt financing, maintaining a healthier balance between debt and equity, which can be viewed positively by investors.
To track all earnings releases for BlackRock visit their earnings calendar on our site.
This article was generated by Benzinga's automated content engine and reviewed by an editor.
Posted In: BLK


