Assessing Hub Group: Insights From 10 Financial Analysts
Author: Benzinga Insights | October 10, 2025 01:00pm
10 analysts have shared their evaluations of Hub Group (NASDAQ:HUBG) during the recent three months, expressing a mix of bullish and bearish perspectives.
The following table summarizes their recent ratings, shedding light on the changing sentiments within the past 30 days and comparing them to the preceding months.
|
Bullish |
Somewhat Bullish |
Indifferent |
Somewhat Bearish |
Bearish |
| Total Ratings |
3 |
3 |
4 |
0 |
0 |
| Last 30D |
0 |
0 |
1 |
0 |
0 |
| 1M Ago |
2 |
1 |
3 |
0 |
0 |
| 2M Ago |
0 |
0 |
0 |
0 |
0 |
| 3M Ago |
1 |
2 |
0 |
0 |
0 |
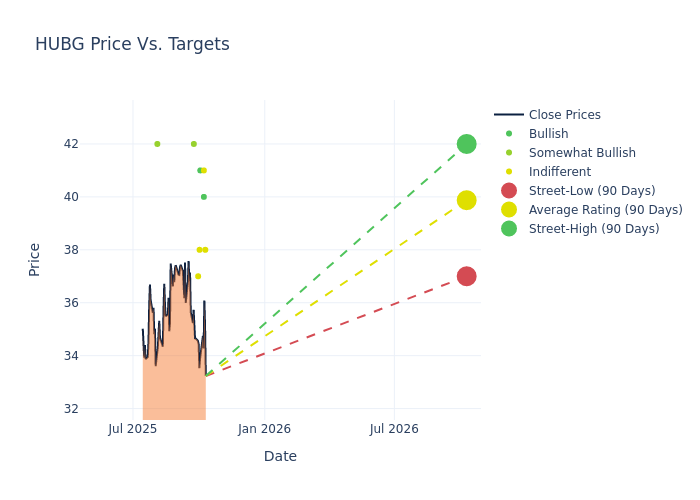
Insights from analysts' 12-month price targets are revealed, presenting an average target of $41.1, a high estimate of $47.00, and a low estimate of $37.00. Highlighting a 2.84% decrease, the current average has fallen from the previous average price target of $42.30.
Understanding Analyst Ratings: A Comprehensive Breakdown
The standing of Hub Group among financial experts is revealed through an in-depth exploration of recent analyst actions. The summary below outlines key analysts, their recent evaluations, and adjustments to ratings and price targets.
| Analyst |
Analyst Firm |
Action Taken |
Rating |
Current Price Target |
Prior Price Target |
| Thomas Wadewitz |
UBS |
Raises |
Neutral |
$38.00 |
$36.00 |
| Brian Ossenbeck |
JP Morgan |
Lowers |
Neutral |
$41.00 |
$43.00 |
| Christopher Kuhn |
Benchmark |
Maintains |
Buy |
$40.00 |
$40.00 |
| J. Bruce Chan |
Stifel |
Lowers |
Buy |
$41.00 |
$45.00 |
| Brandon Oglenski |
Barclays |
Lowers |
Equal-Weight |
$38.00 |
$40.00 |
| Jonathan Chappell |
Evercore ISI Group |
Raises |
In-Line |
$37.00 |
$36.00 |
| Bascome Majors |
Susquehanna |
Lowers |
Positive |
$42.00 |
$47.00 |
| Daniel Moore |
Baird |
Lowers |
Outperform |
$42.00 |
$44.00 |
| J. Bruce Chan |
Stifel |
Lowers |
Buy |
$45.00 |
$46.00 |
| Bascome Majors |
Susquehanna |
Raises |
Positive |
$47.00 |
$46.00 |
Key Insights:
- Action Taken: Analysts respond to changes in market conditions and company performance, frequently updating their recommendations. Whether they 'Maintain', 'Raise' or 'Lower' their stance, it reflects their reaction to recent developments related to Hub Group. This information offers a snapshot of how analysts perceive the current state of the company.
- Rating: Delving into assessments, analysts assign qualitative values, from 'Outperform' to 'Underperform'. These ratings communicate expectations for the relative performance of Hub Group compared to the broader market.
- Price Targets: Understanding forecasts, analysts offer estimates for Hub Group's future value. Examining the current and prior targets provides insight into analysts' changing expectations.
Analyzing these analyst evaluations alongside relevant financial metrics can provide a comprehensive view of Hub Group's market position. Stay informed and make data-driven decisions with the assistance of our Ratings Table.
Stay up to date on Hub Group analyst ratings.
Get to Know Hub Group Better
Hub Group ranks among the largest providers of rail intermodal service. Roughly 60% of consolidated revenue comes from Hub's intermodal and transportation solutions division. ITS includes its flagship intermodal operations, which use the Class I rail carriers for the underlying line-haul movement of containers, as well as its dedicated truckload shipping unit. Hub's logistics segment includes its asset-light truck brokerage operations along with its outsourced transportation management, warehousing and fulfillment, and heavy-goods final mile delivery offerings. Hub often makes tuck-in acquisitions that expand its brokerage, last-mile, and dedicated offerings.
Hub Group: Delving into Financials
Market Capitalization Analysis: Reflecting a smaller scale, the company's market capitalization is positioned below industry averages. This could be attributed to factors such as growth expectations or operational capacity.
Revenue Challenges: Hub Group's revenue growth over 3M faced difficulties. As of 30 June, 2025, the company experienced a decline of approximately -8.2%. This indicates a decrease in top-line earnings. As compared to its peers, the revenue growth lags behind its industry peers. The company achieved a growth rate lower than the average among peers in Industrials sector.
Net Margin: Hub Group's net margin surpasses industry standards, highlighting the company's exceptional financial performance. With an impressive 2.79% net margin, the company effectively manages costs and achieves strong profitability.
Return on Equity (ROE): Hub Group's financial strength is reflected in its exceptional ROE, which exceeds industry averages. With a remarkable ROE of 1.52%, the company showcases efficient use of equity capital and strong financial health.
Return on Assets (ROA): The company's ROA is a standout performer, exceeding industry averages. With an impressive ROA of 0.9%, the company showcases effective utilization of assets.
Debt Management: Hub Group's debt-to-equity ratio is below the industry average. With a ratio of 0.28, the company relies less on debt financing, maintaining a healthier balance between debt and equity, which can be viewed positively by investors.
Analyst Ratings: What Are They?
Benzinga tracks 150 analyst firms and reports on their stock expectations. Analysts typically arrive at their conclusions by predicting how much money a company will make in the future, usually the upcoming five years, and how risky or predictable that company's revenue streams are.
Analysts attend company conference calls and meetings, research company financial statements, and communicate with insiders to publish their ratings on stocks. Analysts typically rate each stock once per quarter or whenever the company has a major update.
Some analysts publish their predictions for metrics such as growth estimates, earnings, and revenue to provide additional guidance with their ratings. When using analyst ratings, it is important to keep in mind that stock and sector analysts are also human and are only offering their opinions to investors.
Which Stocks Are Analysts Recommending Now?
Benzinga Edge gives you instant access to all major analyst upgrades, downgrades, and price targets. Sort by accuracy, upside potential, and more. Click here to stay ahead of the market.
This article was generated by Benzinga's automated content engine and reviewed by an editor.
Posted In: HUBG


