Principal Financial Group Stock: A Deep Dive Into Analyst Perspectives (8 Ratings)
Author: Benzinga Insights | October 08, 2025 04:01pm
In the last three months, 8 analysts have published ratings on Principal Financial Group (NASDAQ:PFG), offering a diverse range of perspectives from bullish to bearish.
The table below offers a condensed view of their recent ratings, showcasing the changing sentiments over the past 30 days and comparing them to the preceding months.
|
Bullish |
Somewhat Bullish |
Indifferent |
Somewhat Bearish |
Bearish |
| Total Ratings |
0 |
0 |
2 |
6 |
0 |
| Last 30D |
0 |
0 |
0 |
2 |
0 |
| 1M Ago |
0 |
0 |
0 |
1 |
0 |
| 2M Ago |
0 |
0 |
0 |
1 |
0 |
| 3M Ago |
0 |
0 |
2 |
2 |
0 |
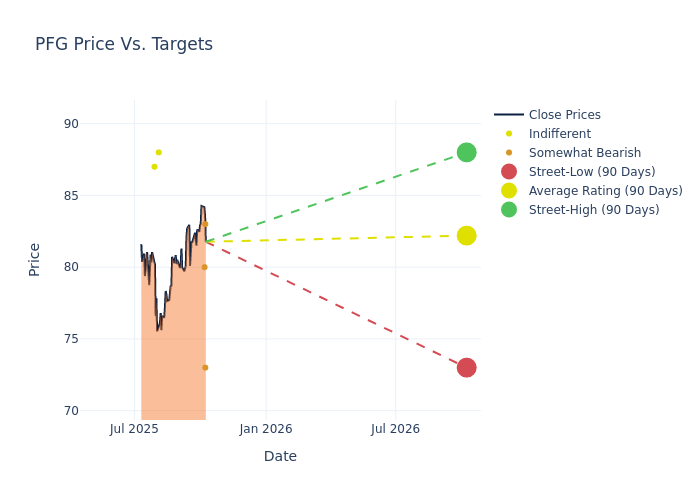
Analysts' evaluations of 12-month price targets offer additional insights, showcasing an average target of $79.38, with a high estimate of $88.00 and a low estimate of $72.00. Surpassing the previous average price target of $77.88, the current average has increased by 1.93%.
Exploring Analyst Ratings: An In-Depth Overview
The standing of Principal Financial Group among financial experts becomes clear with a thorough analysis of recent analyst actions. The summary below outlines key analysts, their recent evaluations, and adjustments to ratings and price targets.
| Analyst |
Analyst Firm |
Action Taken |
Rating |
Current Price Target |
Prior Price Target |
| Alex Scott |
Barclays |
Raises |
Underweight |
$83.00 |
$80.00 |
| Elyse Greenspan |
Wells Fargo |
Raises |
Underweight |
$73.00 |
$72.00 |
| Bob Huang |
Morgan Stanley |
Raises |
Underweight |
$80.00 |
$77.00 |
| Bob Huang |
Morgan Stanley |
Raises |
Underweight |
$77.00 |
$75.00 |
| Ryan Krueger |
Keefe, Bruyette & Woods |
Lowers |
Market Perform |
$88.00 |
$90.00 |
| Elyse Greenspan |
Wells Fargo |
Lowers |
Underweight |
$72.00 |
$73.00 |
| John Nadel |
UBS |
Raises |
Neutral |
$87.00 |
$85.00 |
| Bob Huang |
Morgan Stanley |
Raises |
Underweight |
$75.00 |
$71.00 |
Key Insights:
- Action Taken: Analysts adapt their recommendations to changing market conditions and company performance. Whether they 'Maintain', 'Raise' or 'Lower' their stance, it reflects their response to recent developments related to Principal Financial Group. This information provides a snapshot of how analysts perceive the current state of the company.
- Rating: Analysts assign qualitative assessments to stocks, ranging from 'Outperform' to 'Underperform'. These ratings convey the analysts' expectations for the relative performance of Principal Financial Group compared to the broader market.
- Price Targets: Analysts predict movements in price targets, offering estimates for Principal Financial Group's future value. Examining the current and prior targets offers insights into analysts' evolving expectations.
To gain a panoramic view of Principal Financial Group's market performance, explore these analyst evaluations alongside essential financial indicators. Stay informed and make judicious decisions using our Ratings Table.
Stay up to date on Principal Financial Group analyst ratings.
Get to Know Principal Financial Group Better
Principal Financial Group Inc is a financial services provider. It offers various financial products and services including retirement, asset management, and workplace benefits and protection solutions to individuals and institutional clients. The company, along with its subsidiaries, operates in the following reportable segments; Retirement and Income Solutions, Principal Asset Management, and Benefits and Protection. Maximum revenue is generated from the Retirement and Income Solutions segment which provides workplace savings and retirement solutions, banking, trust and custodial services, individual variable annuities (including RILAs), pension risk transfer, and investment services to businesses, their employees, and other individuals.
Principal Financial Group's Economic Impact: An Analysis
Market Capitalization: Indicating a reduced size compared to industry averages, the company's market capitalization poses unique challenges.
Negative Revenue Trend: Examining Principal Financial Group's financials over 3M reveals challenges. As of 30 June, 2025, the company experienced a decline of approximately -14.83% in revenue growth, reflecting a decrease in top-line earnings. As compared to competitors, the company encountered difficulties, with a growth rate lower than the average among peers in the Financials sector.
Net Margin: Principal Financial Group's financial strength is reflected in its exceptional net margin, which exceeds industry averages. With a remarkable net margin of 11.06%, the company showcases strong profitability and effective cost management.
Return on Equity (ROE): Principal Financial Group's financial strength is reflected in its exceptional ROE, which exceeds industry averages. With a remarkable ROE of 3.59%, the company showcases efficient use of equity capital and strong financial health.
Return on Assets (ROA): The company's ROA is a standout performer, exceeding industry averages. With an impressive ROA of 0.13%, the company showcases effective utilization of assets.
Debt Management: Principal Financial Group's debt-to-equity ratio is below industry norms, indicating a sound financial structure with a ratio of 0.35.
Analyst Ratings: Simplified
Ratings come from analysts, or specialists within banking and financial systems that report for specific stocks or defined sectors (typically once per quarter for each stock). Analysts usually derive their information from company conference calls and meetings, financial statements, and conversations with important insiders to reach their decisions.
Some analysts publish their predictions for metrics such as growth estimates, earnings, and revenue to provide additional guidance with their ratings. When using analyst ratings, it is important to keep in mind that stock and sector analysts are also human and are only offering their opinions to investors.
If you want to keep track of which analysts are outperforming others, you can view updated analyst ratings along withanalyst success scores in Benzinga Pro.
Which Stocks Are Analysts Recommending Now?
Benzinga Edge gives you instant access to all major analyst upgrades, downgrades, and price targets. Sort by accuracy, upside potential, and more. Click here to stay ahead of the market.
This article was generated by Benzinga's automated content engine and reviewed by an editor.
Posted In: PFG


