Where Darling Ingredients Stands With Analysts
Author: Benzinga Insights | October 08, 2025 08:00am
Throughout the last three months, 4 analysts have evaluated Darling Ingredients (NYSE:DAR), offering a diverse set of opinions from bullish to bearish.
Summarizing their recent assessments, the table below illustrates the evolving sentiments in the past 30 days and compares them to the preceding months.
|
Bullish |
Somewhat Bullish |
Indifferent |
Somewhat Bearish |
Bearish |
| Total Ratings |
1 |
2 |
1 |
0 |
0 |
| Last 30D |
1 |
0 |
0 |
0 |
0 |
| 1M Ago |
0 |
0 |
0 |
0 |
0 |
| 2M Ago |
0 |
1 |
0 |
0 |
0 |
| 3M Ago |
0 |
1 |
1 |
0 |
0 |
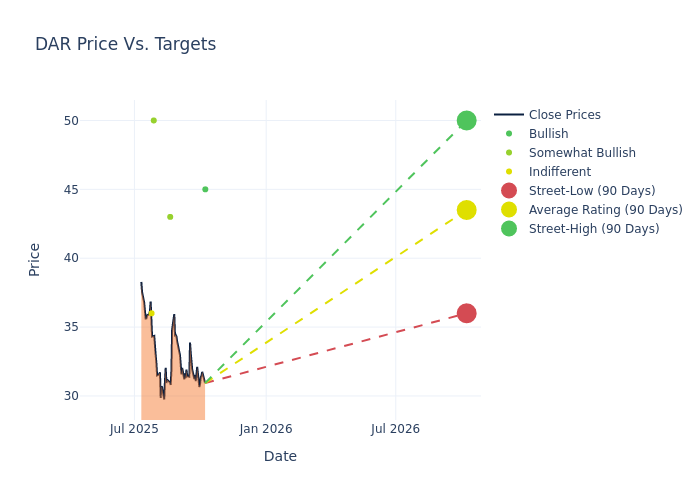
Analysts' evaluations of 12-month price targets offer additional insights, showcasing an average target of $43.5, with a high estimate of $50.00 and a low estimate of $36.00. This current average has decreased by 14.71% from the previous average price target of $51.00.
Investigating Analyst Ratings: An Elaborate Study
The perception of Darling Ingredients by financial experts is analyzed through recent analyst actions. The following summary presents key analysts, their recent evaluations, and adjustments to ratings and price targets.
| Analyst |
Analyst Firm |
Action Taken |
Rating |
Current Price Target |
Prior Price Target |
| Conor Fitzpatrick |
B of A Securities |
Announces |
Buy |
$45.00 |
- |
| Thomas Palmer |
JP Morgan |
Lowers |
Overweight |
$43.00 |
$59.00 |
| Ryan Todd |
Piper Sandler |
Lowers |
Overweight |
$50.00 |
$54.00 |
| Ben Kallo |
Baird |
Lowers |
Neutral |
$36.00 |
$40.00 |
Key Insights:
- Action Taken: In response to dynamic market conditions and company performance, analysts update their recommendations. Whether they 'Maintain', 'Raise', or 'Lower' their stance, it signifies their reaction to recent developments related to Darling Ingredients. This insight gives a snapshot of analysts' perspectives on the current state of the company.
- Rating: Analyzing trends, analysts offer qualitative evaluations, ranging from 'Outperform' to 'Underperform'. These ratings convey expectations for the relative performance of Darling Ingredients compared to the broader market.
- Price Targets: Analysts gauge the dynamics of price targets, providing estimates for the future value of Darling Ingredients's stock. This comparison reveals trends in analysts' expectations over time.
Analyzing these analyst evaluations alongside relevant financial metrics can provide a comprehensive view of Darling Ingredients's market position. Stay informed and make data-driven decisions with the assistance of our Ratings Table.
Stay up to date on Darling Ingredients analyst ratings.
Unveiling the Story Behind Darling Ingredients
Darling Ingredients Inc develops and manufactures sustainable ingredients for customers in the pharmaceutical, food, pet food, fuel, and fertilizer industries. It collects and transforms all aspects of animal by-product streams into ingredients, including gelatin, fats, proteins, pet food ingredients, fertilizers. Also, the company recovers and converts used cooking oil and bakery remnants into feed and fuel ingredients. Darling has three primary business segments which are feed ingredients contributing the majority of revenue, food ingredients, and fuel ingredients. It provides grease trap services for food businesses and sells various equipment for collecting and delivering cooking oil. The company derives the majority of its revenue from customers in North America.
A Deep Dive into Darling Ingredients's Financials
Market Capitalization Analysis: Above industry benchmarks, the company's market capitalization emphasizes a noteworthy size, indicative of a strong market presence.
Revenue Growth: Over the 3M period, Darling Ingredients showcased positive performance, achieving a revenue growth rate of 1.8% as of 30 June, 2025. This reflects a substantial increase in the company's top-line earnings. In comparison to its industry peers, the company trails behind with a growth rate lower than the average among peers in the Consumer Staples sector.
Net Margin: The company's net margin is a standout performer, exceeding industry averages. With an impressive net margin of 0.85%, the company showcases strong profitability and effective cost control.
Return on Equity (ROE): Darling Ingredients's financial strength is reflected in its exceptional ROE, which exceeds industry averages. With a remarkable ROE of 0.28%, the company showcases efficient use of equity capital and strong financial health.
Return on Assets (ROA): The company's ROA is a standout performer, exceeding industry averages. With an impressive ROA of 0.12%, the company showcases effective utilization of assets.
Debt Management: With a high debt-to-equity ratio of 0.91, Darling Ingredients faces challenges in effectively managing its debt levels, indicating potential financial strain.
Analyst Ratings: What Are They?
Benzinga tracks 150 analyst firms and reports on their stock expectations. Analysts typically arrive at their conclusions by predicting how much money a company will make in the future, usually the upcoming five years, and how risky or predictable that company's revenue streams are.
Analysts attend company conference calls and meetings, research company financial statements, and communicate with insiders to publish their ratings on stocks. Analysts typically rate each stock once per quarter or whenever the company has a major update.
Beyond their standard evaluations, some analysts contribute predictions for metrics like growth estimates, earnings, and revenue, furnishing investors with additional guidance. Users of analyst ratings should be mindful that this specialized advice is shaped by human perspectives and may be subject to variability.
Which Stocks Are Analysts Recommending Now?
Benzinga Edge gives you instant access to all major analyst upgrades, downgrades, and price targets. Sort by accuracy, upside potential, and more. Click here to stay ahead of the market.
This article was generated by Benzinga's automated content engine and reviewed by an editor.
Posted In: DAR


