Deep Dive Into U.S. Bancorp Stock: Analyst Perspectives (9 Ratings)
Author: Benzinga Insights | September 17, 2025 03:01pm
Analysts' ratings for U.S. Bancorp (NYSE:USB) over the last quarter vary from bullish to bearish, as provided by 9 analysts.
The table below summarizes their recent ratings, showcasing the evolving sentiments within the past 30 days and comparing them to the preceding months.
|
Bullish |
Somewhat Bullish |
Indifferent |
Somewhat Bearish |
Bearish |
| Total Ratings |
3 |
4 |
2 |
0 |
0 |
| Last 30D |
0 |
0 |
1 |
0 |
0 |
| 1M Ago |
0 |
0 |
0 |
0 |
0 |
| 2M Ago |
1 |
1 |
0 |
0 |
0 |
| 3M Ago |
2 |
3 |
1 |
0 |
0 |
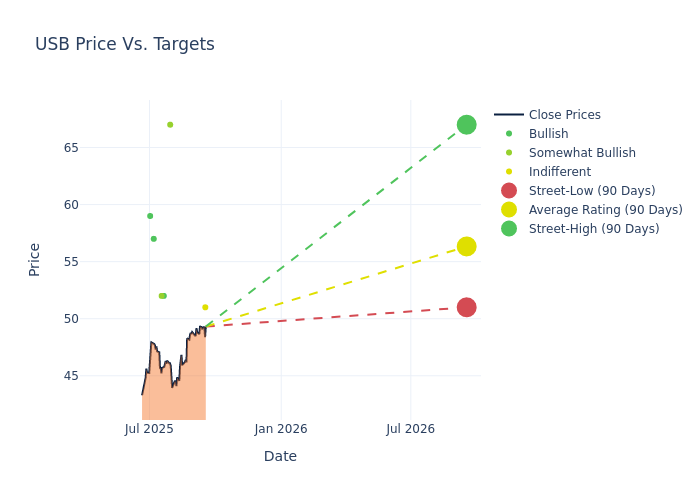
Analysts' evaluations of 12-month price targets offer additional insights, showcasing an average target of $56.11, with a high estimate of $67.00 and a low estimate of $50.00. Observing a 4.33% increase, the current average has risen from the previous average price target of $53.78.
Investigating Analyst Ratings: An Elaborate Study
The standing of U.S. Bancorp among financial experts becomes clear with a thorough analysis of recent analyst actions. The summary below outlines key analysts, their recent evaluations, and adjustments to ratings and price targets.
| Analyst |
Analyst Firm |
Action Taken |
Rating |
Current Price Target |
Prior Price Target |
| John McDonald |
Truist Securities |
Raises |
Hold |
$51.00 |
$49.00 |
| Chris Kotowski |
Oppenheimer |
Raises |
Outperform |
$67.00 |
$66.00 |
| Peter Winter |
DA Davidson |
Raises |
Buy |
$52.00 |
$49.00 |
| Chris Kotowski |
Oppenheimer |
Raises |
Outperform |
$66.00 |
$65.00 |
| Betsy Graseck |
Morgan Stanley |
Raises |
Overweight |
$52.00 |
$51.00 |
| John McDonald |
Truist Securities |
Raises |
Hold |
$50.00 |
$48.00 |
| Michael Rose |
Raymond James |
Raises |
Strong Buy |
$57.00 |
$51.00 |
| Betsy Graseck |
Morgan Stanley |
Raises |
Overweight |
$51.00 |
$50.00 |
| Keith Horowitz |
Citigroup |
Raises |
Buy |
$59.00 |
$55.00 |
Key Insights:
- Action Taken: In response to dynamic market conditions and company performance, analysts update their recommendations. Whether they 'Maintain', 'Raise', or 'Lower' their stance, it signifies their reaction to recent developments related to U.S. Bancorp. This insight gives a snapshot of analysts' perspectives on the current state of the company.
- Rating: Unveiling insights, analysts deliver qualitative insights into stock performance, from 'Outperform' to 'Underperform'. These ratings convey expectations for the relative performance of U.S. Bancorp compared to the broader market.
- Price Targets: Analysts predict movements in price targets, offering estimates for U.S. Bancorp's future value. Examining the current and prior targets offers insights into analysts' evolving expectations.
To gain a panoramic view of U.S. Bancorp's market performance, explore these analyst evaluations alongside essential financial indicators. Stay informed and make judicious decisions using our Ratings Table.
Stay up to date on U.S. Bancorp analyst ratings.
Delving into U.S. Bancorp's Background
With assets of around $685 billion, U.S. Bancorp is one of the largest regional banks in the US with its footprint in 26 states. The bank's branch network is mostly in Midwestern and Western markets. U.S. Bancorp has a comprehensive product set, with offerings in retail and commercial banking, credit cards, mortgages, payment services, trust, and wealth services.
Financial Insights: U.S. Bancorp
Market Capitalization Analysis: Falling below industry benchmarks, the company's market capitalization reflects a reduced size compared to peers. This positioning may be influenced by factors such as growth expectations or operational capacity.
Revenue Growth: U.S. Bancorp's remarkable performance in 3M is evident. As of 30 June, 2025, the company achieved an impressive revenue growth rate of 2.0%. This signifies a substantial increase in the company's top-line earnings. As compared to competitors, the company encountered difficulties, with a growth rate lower than the average among peers in the Financials sector.
Net Margin: The company's net margin is below industry benchmarks, signaling potential difficulties in achieving strong profitability. With a net margin of 24.85%, the company may need to address challenges in effective cost control.
Return on Equity (ROE): U.S. Bancorp's ROE is below industry averages, indicating potential challenges in efficiently utilizing equity capital. With an ROE of 3.21%, the company may face hurdles in achieving optimal financial returns.
Return on Assets (ROA): U.S. Bancorp's financial strength is reflected in its exceptional ROA, which exceeds industry averages. With a remarkable ROA of 0.25%, the company showcases efficient use of assets and strong financial health.
Debt Management: U.S. Bancorp's debt-to-equity ratio is below the industry average. With a ratio of 1.45, the company relies less on debt financing, maintaining a healthier balance between debt and equity, which can be viewed positively by investors.
Analyst Ratings: Simplified
Analyst ratings serve as essential indicators of stock performance, provided by experts in banking and financial systems. These specialists diligently analyze company financial statements, participate in conference calls, and engage with insiders to generate quarterly ratings for individual stocks.
Some analysts publish their predictions for metrics such as growth estimates, earnings, and revenue to provide additional guidance with their ratings. When using analyst ratings, it is important to keep in mind that stock and sector analysts are also human and are only offering their opinions to investors.
If you want to keep track of which analysts are outperforming others, you can view updated analyst ratings along withanalyst success scores in Benzinga Pro.
Breaking: Wall Street's Next Big Mover
Benzinga's #1 analyst just identified a stock poised for explosive growth. This under-the-radar company could surge 200%+ as major market shifts unfold. Click here for urgent details.
This article was generated by Benzinga's automated content engine and reviewed by an editor.
Posted In: USB


