Demystifying 10x Genomics: Insights From 8 Analyst Reviews
Author: Benzinga Insights | June 24, 2025 03:00pm
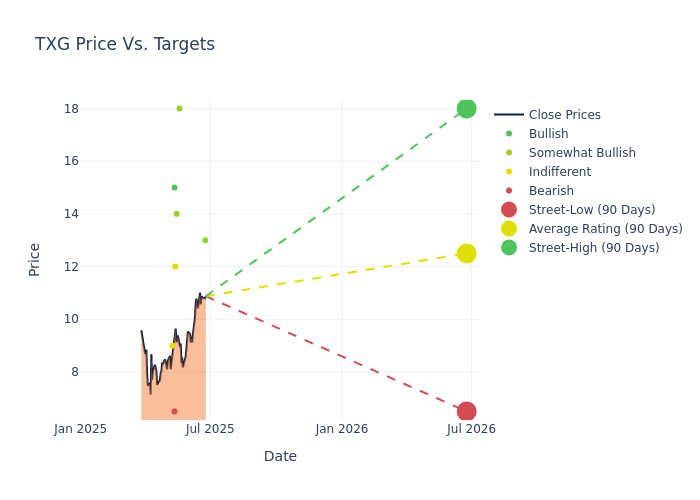
8 analysts have shared their evaluations of 10x Genomics (NASDAQ:TXG) during the recent three months, expressing a mix of bullish and bearish perspectives.
The table below summarizes their recent ratings, showcasing the evolving sentiments within the past 30 days and comparing them to the preceding months.
|
Bullish |
Somewhat Bullish |
Indifferent |
Somewhat Bearish |
Bearish |
| Total Ratings |
1 |
4 |
2 |
0 |
1 |
| Last 30D |
0 |
1 |
0 |
0 |
0 |
| 1M Ago |
0 |
0 |
0 |
0 |
0 |
| 2M Ago |
1 |
2 |
2 |
0 |
1 |
| 3M Ago |
0 |
1 |
0 |
0 |
0 |
Insights from analysts' 12-month price targets are revealed, presenting an average target of $12.44, a high estimate of $18.00, and a low estimate of $6.50. A negative shift in sentiment is evident as analysts have decreased the average price target by 16.0%.
Analyzing Analyst Ratings: A Detailed Breakdown
In examining recent analyst actions, we gain insights into how financial experts perceive 10x Genomics. The following summary outlines key analysts, their recent evaluations, and adjustments to ratings and price targets.
| Analyst |
Analyst Firm |
Action Taken |
Rating |
Current Price Target |
Prior Price Target |
| Luke Sergott |
Barclays |
Raises |
Overweight |
$13.00 |
$12.00 |
| Tejas Savant |
Morgan Stanley |
Lowers |
Overweight |
$18.00 |
$26.00 |
| Mason Carrico |
Stephens & Co. |
Maintains |
Overweight |
$14.00 |
$14.00 |
| Dan Leonard |
UBS |
Lowers |
Neutral |
$12.00 |
$14.00 |
| Matthew Sykes |
Goldman Sachs |
Lowers |
Sell |
$6.50 |
$7.50 |
| Kyle Mikson |
Canaccord Genuity |
Lowers |
Buy |
$15.00 |
$18.00 |
| Rachel Vatnsdal |
JP Morgan |
Lowers |
Neutral |
$9.00 |
$12.00 |
| Luke Sergott |
Barclays |
Lowers |
Overweight |
$12.00 |
$15.00 |
Key Insights:
- Action Taken: In response to dynamic market conditions and company performance, analysts update their recommendations. Whether they 'Maintain', 'Raise', or 'Lower' their stance, it signifies their reaction to recent developments related to 10x Genomics. This insight gives a snapshot of analysts' perspectives on the current state of the company.
- Rating: Providing a comprehensive analysis, analysts offer qualitative assessments, ranging from 'Outperform' to 'Underperform'. These ratings reflect expectations for the relative performance of 10x Genomics compared to the broader market.
- Price Targets: Analysts provide insights into price targets, offering estimates for the future value of 10x Genomics's stock. This comparison reveals trends in analysts' expectations over time.
Assessing these analyst evaluations alongside crucial financial indicators can provide a comprehensive overview of 10x Genomics's market position. Stay informed and make well-judged decisions with the assistance of our Ratings Table.
Stay up to date on 10x Genomics analyst ratings.
If you are interested in following small-cap stock news and performance you can start by tracking it here.
About 10x Genomics
10x Genomics Inc is a life science technology company based in the United States. Its solutions include instruments, consumables, and software for analyzing biological systems. The company's integrated solutions include instruments, consumables, and software for analyzing biological systems at a resolution and scale that matches the complexity of biology. Its product offerings include a Chromium platform comprising microfluidic chips and related consumables, Chromium X series, Visium and Xenium platforms, and others, which are predominantly used for the study of biological components. Geographically, the company derives maximum revenue from the United States and the rest from Americas (excluding the United States), Europe, Middle East and Africa, China, and Asia-Pacific (excluding China).
A Deep Dive into 10x Genomics's Financials
Market Capitalization Analysis: Reflecting a smaller scale, the company's market capitalization is positioned below industry averages. This could be attributed to factors such as growth expectations or operational capacity.
Revenue Growth: Over the 3M period, 10x Genomics showcased positive performance, achieving a revenue growth rate of 9.84% as of 31 March, 2025. This reflects a substantial increase in the company's top-line earnings. As compared to its peers, the company achieved a growth rate higher than the average among peers in Health Care sector.
Net Margin: 10x Genomics's financial strength is reflected in its exceptional net margin, which exceeds industry averages. With a remarkable net margin of -22.18%, the company showcases strong profitability and effective cost management.
Return on Equity (ROE): 10x Genomics's ROE is below industry averages, indicating potential challenges in efficiently utilizing equity capital. With an ROE of -4.85%, the company may face hurdles in achieving optimal financial returns.
Return on Assets (ROA): The company's ROA is below industry benchmarks, signaling potential difficulties in efficiently utilizing assets. With an ROA of -3.77%, the company may need to address challenges in generating satisfactory returns from its assets.
Debt Management: 10x Genomics's debt-to-equity ratio is below the industry average. With a ratio of 0.11, the company relies less on debt financing, maintaining a healthier balance between debt and equity, which can be viewed positively by investors.
The Basics of Analyst Ratings
Experts in banking and financial systems, analysts specialize in reporting for specific stocks or defined sectors. Their comprehensive research involves attending company conference calls and meetings, analyzing financial statements, and engaging with insiders to generate what are known as analyst ratings for stocks. Typically, analysts assess and rate each stock once per quarter.
In addition to their assessments, some analysts extend their insights by offering predictions for key metrics such as earnings, revenue, and growth estimates. This supplementary information provides further guidance for traders. It is crucial to recognize that, despite their specialization, analysts are human and can only provide forecasts based on their beliefs.
Which Stocks Are Analysts Recommending Now?
Benzinga Edge gives you instant access to all major analyst upgrades, downgrades, and price targets. Sort by accuracy, upside potential, and more. Click here to stay ahead of the market.
This article was generated by Benzinga's automated content engine and reviewed by an editor.
Posted In: TXG