PDD Stock: Temu's Potential, Billionaire David Tepper's Conviction Fuel Bullish Signals Ahead Of Q1 Earnings
Author: Surbhi Jain | May 20, 2024 11:37am
Pinduoduo Inc. (NASDAQ:PDD) has demonstrated notable stock performance, reflecting strong market interest and investor confidence. The company is set to report Q1 earnings on Wednesday. Wall Street expects PDD to post $1.43 in EPS and $10.6 billion in revenue, as it reports before market hours.
At the time of publication on Monday, the stock was up 1.2% to $147.96. Over the past year, PDD stock has surged by 134%, and is up 1.6% in 2024. This performance underscores the stock’s resilience and potential for continued growth.
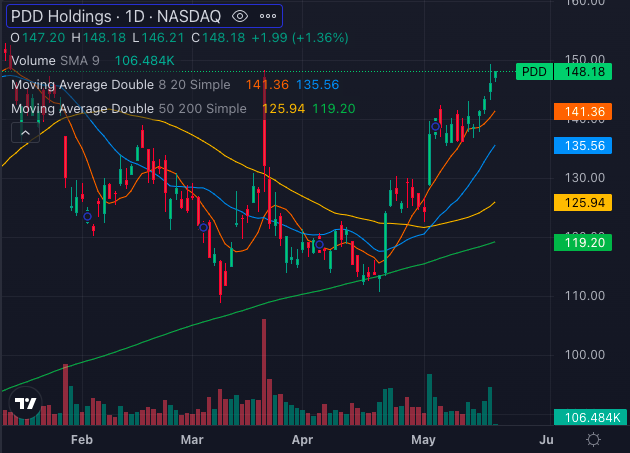
Several Bullish Indicators On PDD Stock Charts
From a technical analysis perspective, PDD is exhibiting several bullish indicators.
The stock is currently trading above its key moving averages, which signals sustained upward momentum. The share price of PDD is above the 8-day simple moving average (SMA) which indicates a bullish signal, reflecting short-term bullish sentiment.
The 20-day Simple Moving Average (SMA) suggests ongoing bullish momentum, with the stock price well above this short-term average. The 50-day SMA indicates a strong medium-term bullish trend, as the stock price remains higher than this average as well. Additionally, the 200-day SMA points to a prevailing long-term bullish sentiment, further reinforcing the overall positive outlook for the stock.
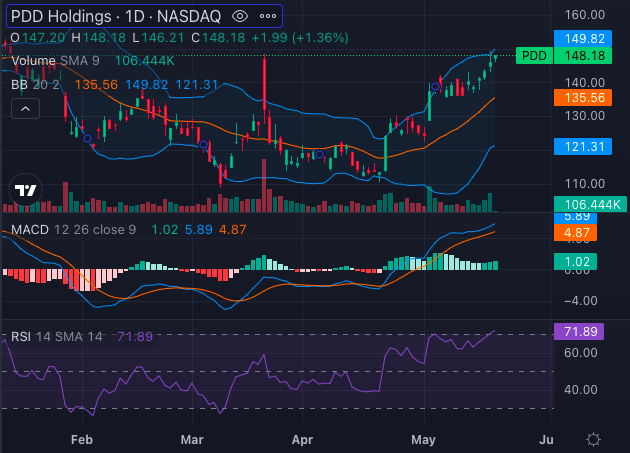
The Moving Average Convergence Divergence (MACD) indicator, standing at 5.89, suggests a strong bullish signal, indicating that the momentum is in favor of PDD stock.
However, the Relative Strength Index (RSI) at 71.89 suggests that the stock is currently overbought, which could signal potential short-term volatility or a pullback.
The Bollinger Bands analysis also supports a bullish outlook as well. The Bollinger Bands range between $121.31 and $149.82. With the current price well within these bands, and in fact trading in the upper (bullish) band, the stock is reflecting positive investor sentiment.
Analyst Bullish On Temu’s Potential, David Tepper Loading Up PDD Stock
Recent news has provided additional support for PDD’s bullish technical indicators.
UBS has raised its price target for Pinduoduo shares from $217 to $248, maintaining a Buy rating. This optimism is driven by the market potential of Temu, Pinduoduo’s overseas platform targeting low-income consumers. UBS believes that the market may be underestimating Temu’s geopolitical risks and its potential for significant market expansion, which could result in higher margins due to its managed e-commerce model.
Moreover, American billionaire hedge fund manager David Tepper has shown confidence in PDD, with Appaloosa Management purchasing 1.325 million shares in the first quarter of 2024, now holding 3.61% of the portfolio. This bullish stance from a prominent investor further boosts market confidence in PDD.
Pinduoduo stock exhibits strong bullish technical indicators supported by favorable market news and analyst upgrades. While the RSI suggests caution due to overbought conditions, the overall technical landscape and positive news flow position PDD as a compelling stock for investors.