A Closer Look at 6 Analyst Recommendations For Manhattan Associates
Author: Benzinga Insights | May 14, 2024 09:01am
In the latest quarter, 6 analysts provided ratings for Manhattan Associates (NASDAQ:MANH), showcasing a mix of bullish and bearish perspectives.
In the table below, you'll find a summary of their recent ratings, revealing the shifting sentiments over the past 30 days and comparing them to the previous months.
|
Bullish |
Somewhat Bullish |
Indifferent |
Somewhat Bearish |
Bearish |
| Total Ratings |
2 |
0 |
4 |
0 |
0 |
| Last 30D |
1 |
0 |
0 |
0 |
0 |
| 1M Ago |
1 |
0 |
3 |
0 |
0 |
| 2M Ago |
0 |
0 |
0 |
0 |
0 |
| 3M Ago |
0 |
0 |
1 |
0 |
0 |
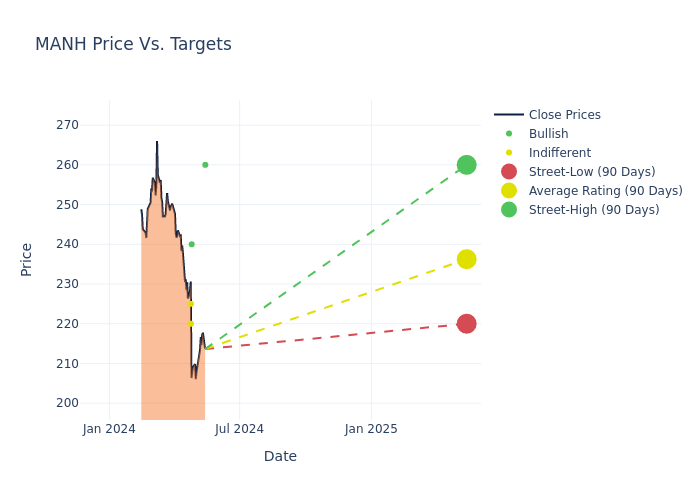
Analysts have set 12-month price targets for Manhattan Associates, revealing an average target of $238.33, a high estimate of $260.00, and a low estimate of $220.00. Surpassing the previous average price target of $232.50, the current average has increased by 2.51%.
Breaking Down Analyst Ratings: A Detailed Examination
An in-depth analysis of recent analyst actions unveils how financial experts perceive Manhattan Associates. The following summary outlines key analysts, their recent evaluations, and adjustments to ratings and price targets.
| Analyst |
Analyst Firm |
Action Taken |
Rating |
Current Price Target |
Prior Price Target |
| Lachlan Brown |
Redburn Atlantic |
Announces |
Buy |
$260.00 |
- |
| Gil Luria |
DA Davidson |
Raises |
Buy |
$240.00 |
$220.00 |
| George Kurosawa |
Citigroup |
Lowers |
Neutral |
$220.00 |
$260.00 |
| Blair Abernethy |
Rosenblatt |
Maintains |
Neutral |
$225.00 |
$225.00 |
| Blair Abernethy |
Rosenblatt |
Maintains |
Neutral |
$225.00 |
$225.00 |
| George Kurosawa |
Citigroup |
Announces |
Neutral |
$260.00 |
- |
Key Insights:
- Action Taken: Responding to changing market dynamics and company performance, analysts update their recommendations. Whether they 'Maintain', 'Raise', or 'Lower' their stance, it signifies their response to recent developments related to Manhattan Associates. This offers insight into analysts' perspectives on the current state of the company.
- Rating: Analysts unravel qualitative evaluations for stocks, ranging from 'Outperform' to 'Underperform'. These ratings offer insights into expectations for the relative performance of Manhattan Associates compared to the broader market.
- Price Targets: Analysts provide insights into price targets, offering estimates for the future value of Manhattan Associates's stock. This comparison reveals trends in analysts' expectations over time.
Navigating through these analyst evaluations alongside other financial indicators can contribute to a holistic understanding of Manhattan Associates's market standing. Stay informed and make data-driven decisions with our Ratings Table.
Stay up to date on Manhattan Associates analyst ratings.
Unveiling the Story Behind Manhattan Associates
Manhattan Associates provides software that helps users manage their supply chains, inventory, and omnichannel operations. Customers are generally retailers, wholesalers, manufacturers, and logistics providers. The company was founded in 1990 and serves more than 1,200 customers around the world.
Breaking Down Manhattan Associates's Financial Performance
Market Capitalization Perspectives: The company's market capitalization falls below industry averages, signaling a relatively smaller size compared to peers. This positioning may be influenced by factors such as perceived growth potential or operational scale.
Revenue Growth: Manhattan Associates's remarkable performance in 3 months is evident. As of 31 March, 2024, the company achieved an impressive revenue growth rate of 15.18%. This signifies a substantial increase in the company's top-line earnings. As compared to its peers, the revenue growth lags behind its industry peers. The company achieved a growth rate lower than the average among peers in Information Technology sector.
Net Margin: Manhattan Associates's financial strength is reflected in its exceptional net margin, which exceeds industry averages. With a remarkable net margin of 21.14%, the company showcases strong profitability and effective cost management.
Return on Equity (ROE): Manhattan Associates's financial strength is reflected in its exceptional ROE, which exceeds industry averages. With a remarkable ROE of 20.78%, the company showcases efficient use of equity capital and strong financial health.
Return on Assets (ROA): Manhattan Associates's ROA stands out, surpassing industry averages. With an impressive ROA of 7.98%, the company demonstrates effective utilization of assets and strong financial performance.
Debt Management: Manhattan Associates's debt-to-equity ratio is below the industry average. With a ratio of 0.22, the company relies less on debt financing, maintaining a healthier balance between debt and equity, which can be viewed positively by investors.
How Are Analyst Ratings Determined?
Analysts work in banking and financial systems and typically specialize in reporting for stocks or defined sectors. Analysts may attend company conference calls and meetings, research company financial statements, and communicate with insiders to publish "analyst ratings" for stocks. Analysts typically rate each stock once per quarter.
Some analysts will also offer forecasts for metrics like growth estimates, earnings, and revenue to provide further guidance on stocks. Investors who use analyst ratings should note that this specialized advice comes from humans and may be subject to error.
This article was generated by Benzinga's automated content engine and reviewed by an editor.
Posted In: MANH