Market Analysis: Meta Platforms And Competitors In Interactive Media & Services Industry
Author: Benzinga Insights | May 10, 2024 11:00am
Amidst the fast-paced and highly competitive business environment of today, conducting comprehensive company analysis is essential for investors and industry enthusiasts. In this article, we will delve into an extensive industry comparison, evaluating Meta Platforms (NASDAQ:META) in comparison to its major competitors within the Interactive Media & Services industry. By analyzing critical financial metrics, market position, and growth potential, our objective is to provide valuable insights for investors and offer a deeper understanding of company's performance in the industry.
Meta Platforms Background
Meta is the world's largest online social network, with nearly 4 billion family of apps monthly active users. Users engage with each other in different ways, exchanging messages and sharing news events, photos, and videos. The firm's ecosystem consists mainly of the Facebook app, Instagram, Messenger, WhatsApp, and many features surrounding these products. Users can access Facebook on mobile devices and desktops. Advertising revenue represents more than 90% of the firm's total revenue, with more than 45% coming from the US and Canada and over 20% from Europe.
| Company |
P/E |
P/B |
P/S |
ROE |
EBITDA (in billions) |
Gross Profit (in billions) |
Revenue Growth |
| Meta Platforms Inc |
27.37 |
8.07 |
8.79 |
8.17% |
$17.68 |
$29.82 |
27.26% |
| Alphabet Inc |
26.07 |
7.17 |
6.75 |
8.21% |
$31.82 |
$46.83 |
15.41% |
| Baidu Inc |
14.31 |
1.14 |
2.08 |
0.77% |
$3.64 |
$17.53 |
5.67% |
| Pinterest Inc |
193.86 |
9.27 |
9.01 |
-0.8% |
$-0.05 |
$0.56 |
22.8% |
| Kanzhun Ltd |
59.39 |
4.78 |
10.99 |
2.46% |
$0.22 |
$1.31 |
46.01% |
| ZoomInfo Technologies Inc |
62.90 |
2.35 |
3.94 |
0.73% |
$0.06 |
$0.27 |
3.13% |
| Autohome Inc |
13.47 |
1.04 |
3.53 |
1.78% |
$0.37 |
$1.54 |
0.96% |
| Yelp Inc |
29.35 |
3.59 |
2.18 |
3.68% |
$0.04 |
$0.31 |
10.76% |
| Tripadvisor Inc |
114.50 |
3.09 |
1.46 |
-6.96% |
$0.02 |
$0.36 |
6.47% |
| Ziff Davis Inc |
61.94 |
1.34 |
1.88 |
3.43% |
$0.15 |
$0.34 |
-1.72% |
| Weibo Corp |
6.77 |
0.69 |
1.32 |
2.52% |
$0.27 |
$0.36 |
3.5% |
| CarGurus Inc |
117.21 |
3.79 |
2.78 |
-3.56% |
$-0.01 |
$0.17 |
-22.19% |
| JOYY Inc |
7.08 |
0.39 |
1.10 |
0.89% |
$0.05 |
$0.2 |
-5.8% |
| Getty Images Holdings Inc |
77.40 |
2.50 |
1.74 |
6.56% |
$0.03 |
$0.16 |
-2.39% |
| Bumble Inc |
67.35 |
0.90 |
1.43 |
1.52% |
$0.07 |
$0.19 |
-2.14% |
| Average |
60.83 |
3.0 |
3.59 |
1.52% |
$2.62 |
$5.01 |
5.75% |
When closely examining Meta Platforms, the following trends emerge:
-
At 27.37, the stock's Price to Earnings ratio is 0.45x less than the industry average, suggesting favorable growth potential.
-
It could be trading at a premium in relation to its book value, as indicated by its Price to Book ratio of 8.07 which exceeds the industry average by 2.69x.
-
With a relatively high Price to Sales ratio of 8.79, which is 2.45x the industry average, the stock might be considered overvalued based on sales performance.
-
The company has a higher Return on Equity (ROE) of 8.17%, which is 6.65% above the industry average. This suggests efficient use of equity to generate profits and demonstrates profitability and growth potential.
-
The Earnings Before Interest, Taxes, Depreciation, and Amortization (EBITDA) of $17.68 Billion is 6.75x above the industry average, highlighting stronger profitability and robust cash flow generation.
-
With higher gross profit of $29.82 Billion, which indicates 5.95x above the industry average, the company demonstrates stronger profitability and higher earnings from its core operations.
-
The company's revenue growth of 27.26% exceeds the industry average of 5.75%, indicating strong sales performance and market outperformance.
Debt To Equity Ratio
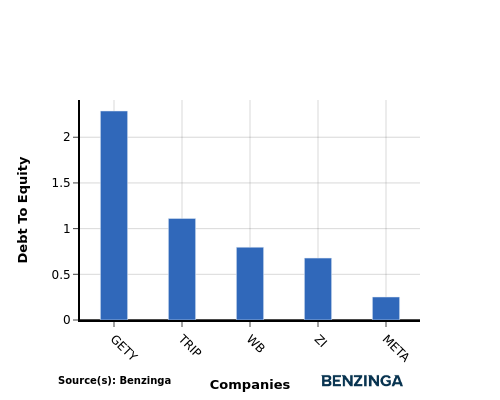
The debt-to-equity (D/E) ratio helps evaluate the capital structure and financial leverage of a company.
Considering the debt-to-equity ratio in industry comparisons allows for a concise evaluation of a company's financial health and risk profile, aiding in informed decision-making.
When assessing Meta Platforms against its top 4 peers using the Debt-to-Equity ratio, the following comparisons can be made:
-
When comparing the debt-to-equity ratio, Meta Platforms is in a stronger financial position compared to its top 4 peers.
-
The company has a lower level of debt relative to its equity, indicating a more favorable balance between the two with a lower debt-to-equity ratio of 0.25.
Key Takeaways
For Meta Platforms, the PE ratio is low compared to peers, indicating potential undervaluation. The PB and PS ratios are high, suggesting overvaluation relative to industry standards. In terms of ROE, EBITDA, gross profit, and revenue growth, Meta Platforms outperforms its peers, reflecting strong financial performance and growth potential in the Interactive Media & Services industry.
This article was generated by Benzinga's automated content engine and reviewed by an editor.
Posted In: META


