Demystifying Chart Industries: Insights From 7 Analyst Reviews
Author: Benzinga Insights | May 06, 2024 05:00pm
Analysts' ratings for Chart Industries (NYSE:GTLS) over the last quarter vary from bullish to bearish, as provided by 7 analysts.
The table below offers a condensed view of their recent ratings, showcasing the changing sentiments over the past 30 days and comparing them to the preceding months.
|
Bullish |
Somewhat Bullish |
Indifferent |
Somewhat Bearish |
Bearish |
| Total Ratings |
3 |
1 |
3 |
0 |
0 |
| Last 30D |
2 |
0 |
1 |
0 |
0 |
| 1M Ago |
0 |
0 |
1 |
0 |
0 |
| 2M Ago |
1 |
0 |
1 |
0 |
0 |
| 3M Ago |
0 |
1 |
0 |
0 |
0 |
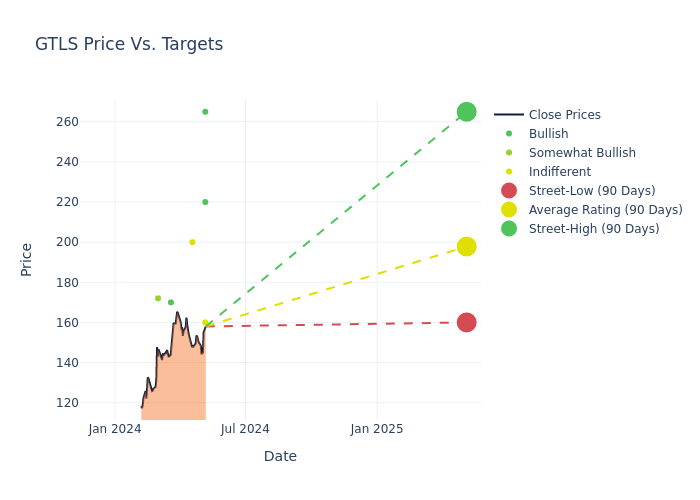
Insights from analysts' 12-month price targets are revealed, presenting an average target of $191.14, a high estimate of $265.00, and a low estimate of $151.00. This upward trend is apparent, with the current average reflecting a 5.99% increase from the previous average price target of $180.33.
Breaking Down Analyst Ratings: A Detailed Examination
The perception of Chart Industries by financial experts is analyzed through recent analyst actions. The following summary presents key analysts, their recent evaluations, and adjustments to ratings and price targets.
| Analyst |
Analyst Firm |
Action Taken |
Rating |
Current Price Target |
Prior Price Target |
| Benjamin Nolan |
Stifel |
Lowers |
Buy |
$220.00 |
$224.00 |
| Marc Bianchi |
TD Cowen |
Raises |
Buy |
$265.00 |
$260.00 |
| Ian Macpherson |
Piper Sandler |
Raises |
Neutral |
$160.00 |
$151.00 |
| Connor Lynagh |
Morgan Stanley |
Announces |
Equal-Weight |
$200.00 |
- |
| Manav Gupta |
UBS |
Raises |
Buy |
$170.00 |
$152.00 |
| Ian Macpherson |
Piper Sandler |
Raises |
Neutral |
$151.00 |
$140.00 |
| Roger Read |
Wells Fargo |
Raises |
Overweight |
$172.00 |
$155.00 |
Key Insights:
- Action Taken: Analysts frequently update their recommendations based on evolving market conditions and company performance. Whether they 'Maintain', 'Raise' or 'Lower' their stance, it reflects their reaction to recent developments related to Chart Industries. This information provides a snapshot of how analysts perceive the current state of the company.
- Rating: Delving into assessments, analysts assign qualitative values, from 'Outperform' to 'Underperform'. These ratings communicate expectations for the relative performance of Chart Industries compared to the broader market.
- Price Targets: Analysts gauge the dynamics of price targets, providing estimates for the future value of Chart Industries's stock. This comparison reveals trends in analysts' expectations over time.
Assessing these analyst evaluations alongside crucial financial indicators can provide a comprehensive overview of Chart Industries's market position. Stay informed and make well-judged decisions with the assistance of our Ratings Table.
Stay up to date on Chart Industries analyst ratings.
Unveiling the Story Behind Chart Industries
Chart Industries provides a variety of cryogenic equipment for storage, distribution, and other processes within the industrial gas and liquefied natural gas (LNG) industries. It also provides natural gas processing solutions for the natural gas industry and specialty products that serve a variety of spaces, including hydrogen, biofuels, cannabis, and water treatment. The firm acquired Howden in a significant deal in early 2023, roughly doubling the size of the company.
Financial Milestones: Chart Industries's Journey
Market Capitalization Perspectives: The company's market capitalization falls below industry averages, signaling a relatively smaller size compared to peers. This positioning may be influenced by factors such as perceived growth potential or operational scale.
Revenue Growth: Chart Industries displayed positive results in 3 months. As of 31 December, 2023, the company achieved a solid revenue growth rate of approximately 129.95%. This indicates a notable increase in the company's top-line earnings. As compared to competitors, the company surpassed expectations with a growth rate higher than the average among peers in the Industrials sector.
Net Margin: Chart Industries's net margin falls below industry averages, indicating challenges in achieving strong profitability. With a net margin of 4.24%, the company may face hurdles in effective cost management.
Return on Equity (ROE): Chart Industries's ROE falls below industry averages, indicating challenges in efficiently using equity capital. With an ROE of 1.59%, the company may face hurdles in generating optimal returns for shareholders.
Return on Assets (ROA): Chart Industries's ROA lags behind industry averages, suggesting challenges in maximizing returns from its assets. With an ROA of 0.47%, the company may face hurdles in achieving optimal financial performance.
Debt Management: Chart Industries's debt-to-equity ratio is notably higher than the industry average. With a ratio of 1.4, the company relies more heavily on borrowed funds, indicating a higher level of financial risk.
The Significance of Analyst Ratings Explained
Analyst ratings serve as essential indicators of stock performance, provided by experts in banking and financial systems. These specialists diligently analyze company financial statements, participate in conference calls, and engage with insiders to generate quarterly ratings for individual stocks.
Beyond their standard evaluations, some analysts contribute predictions for metrics like growth estimates, earnings, and revenue, furnishing investors with additional guidance. Users of analyst ratings should be mindful that this specialized advice is shaped by human perspectives and may be subject to variability.
This article was generated by Benzinga's automated content engine and reviewed by an editor.
Posted In: GTLS