4 Analysts Have This To Say About Standex International
Author: Benzinga Insights | May 06, 2024 01:00pm
In the last three months, 4 analysts have published ratings on Standex International (NYSE:SXI), offering a diverse range of perspectives from bullish to bearish.
The following table provides a quick overview of their recent ratings, highlighting the changing sentiments over the past 30 days and comparing them to the preceding months.
|
Bullish |
Somewhat Bullish |
Indifferent |
Somewhat Bearish |
Bearish |
| Total Ratings |
3 |
1 |
0 |
0 |
0 |
| Last 30D |
1 |
1 |
0 |
0 |
0 |
| 1M Ago |
1 |
0 |
0 |
0 |
0 |
| 2M Ago |
1 |
0 |
0 |
0 |
0 |
| 3M Ago |
0 |
0 |
0 |
0 |
0 |
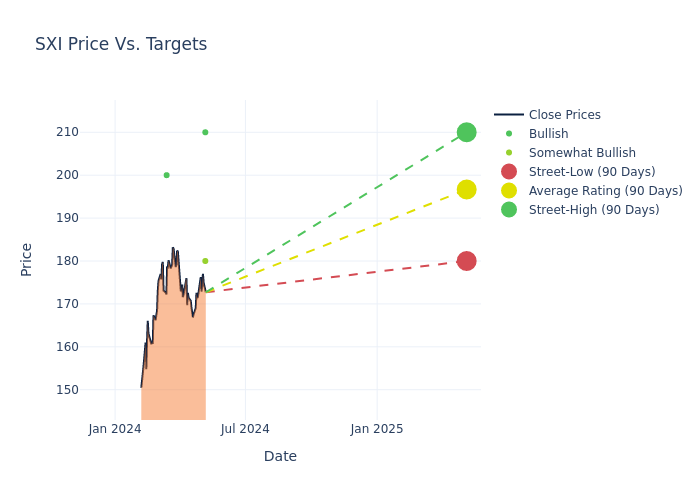
Providing deeper insights, analysts have established 12-month price targets, indicating an average target of $195.0, along with a high estimate of $210.00 and a low estimate of $180.00. This current average has increased by 9.35% from the previous average price target of $178.33.
Decoding Analyst Ratings: A Detailed Look
In examining recent analyst actions, we gain insights into how financial experts perceive Standex International. The following summary outlines key analysts, their recent evaluations, and adjustments to ratings and price targets.
| Analyst |
Analyst Firm |
Action Taken |
Rating |
Current Price Target |
Prior Price Target |
| Gary Prestopino |
Barrington Research |
Maintains |
Outperform |
$180.00 |
$180.00 |
| Michael Legg |
Benchmark |
Raises |
Buy |
$210.00 |
$190.00 |
| Michael Legg |
Benchmark |
Maintains |
Buy |
$190.00 |
- |
| Michael Shlisky |
DA Davidson |
Raises |
Buy |
$200.00 |
$165.00 |
Key Insights:
- Action Taken: Analysts respond to changes in market conditions and company performance, frequently updating their recommendations. Whether they 'Maintain', 'Raise' or 'Lower' their stance, it reflects their reaction to recent developments related to Standex International. This information offers a snapshot of how analysts perceive the current state of the company.
- Rating: Unveiling insights, analysts deliver qualitative insights into stock performance, from 'Outperform' to 'Underperform'. These ratings convey expectations for the relative performance of Standex International compared to the broader market.
- Price Targets: Analysts set price targets as an estimate of a stock's future value. Comparing the current and prior price targets provides insight into how analysts' expectations have changed over time. This information can be valuable for investors seeking to understand consensus views on the stock's potential future performance.
Understanding these analyst evaluations alongside key financial indicators can offer valuable insights into Standex International's market standing. Stay informed and make well-considered decisions with our Ratings Table.
Stay up to date on Standex International analyst ratings.
Get to Know Standex International Better
Standex International Corp is a us-based firm. It engages in manufacturing a variety of products and services for several commercial and industrial markets. It has five segments that include Electronics; Engraving; Scientific; Engineering Technologies and Specialty Solutions. With its business spread majorly in the United States, most of the company revenues come from the Electronics business that primarily includes manufacturing and selling of electronic components for applications throughout the end-user market spectrum.
Understanding the Numbers: Standex International's Finances
Market Capitalization Perspectives: The company's market capitalization falls below industry averages, signaling a relatively smaller size compared to peers. This positioning may be influenced by factors such as perceived growth potential or operational scale.
Revenue Challenges: Standex International's revenue growth over 3 months faced difficulties. As of 31 December, 2023, the company experienced a decline of approximately -5.0%. This indicates a decrease in top-line earnings. As compared to its peers, the revenue growth lags behind its industry peers. The company achieved a growth rate lower than the average among peers in Industrials sector.
Net Margin: Standex International's net margin surpasses industry standards, highlighting the company's exceptional financial performance. With an impressive 10.58% net margin, the company effectively manages costs and achieves strong profitability.
Return on Equity (ROE): Standex International's ROE stands out, surpassing industry averages. With an impressive ROE of 3.11%, the company demonstrates effective use of equity capital and strong financial performance.
Return on Assets (ROA): The company's ROA is a standout performer, exceeding industry averages. With an impressive ROA of 1.9%, the company showcases effective utilization of assets.
Debt Management: With a below-average debt-to-equity ratio of 0.3, Standex International adopts a prudent financial strategy, indicating a balanced approach to debt management.
How Are Analyst Ratings Determined?
Benzinga tracks 150 analyst firms and reports on their stock expectations. Analysts typically arrive at their conclusions by predicting how much money a company will make in the future, usually the upcoming five years, and how risky or predictable that company's revenue streams are.
Analysts attend company conference calls and meetings, research company financial statements, and communicate with insiders to publish their ratings on stocks. Analysts typically rate each stock once per quarter or whenever the company has a major update.
Some analysts publish their predictions for metrics such as growth estimates, earnings, and revenue to provide additional guidance with their ratings. When using analyst ratings, it is important to keep in mind that stock and sector analysts are also human and are only offering their opinions to investors.
If you want to keep track of which analysts are outperforming others, you can view updated analyst ratings along withanalyst success scores in Benzinga Pro.
This article was generated by Benzinga's automated content engine and reviewed by an editor.
Posted In: SXI