As Large-Cap Stocks Take A Breather And The SPY Trades Sideways, Will Small-Cap Stocks Steal The Spotlight?
Author: Melanie Schaffer | May 06, 2024 01:01pm
Infrastructure Capital Advisors’ InfraCap Small Cap Income ETF (NYSE:SCAP) gapped up about 1% higher on Monday, the second consecutive northernly gap after closing about 0.9% higher on Friday.
SCAP is a value fund, which is made up of the iShares Russell 2000 ETF (NYSE:IWM), weighted at 18.13% and a basket of small-cap stocks. Currently, the fund may be of particular interest to cyclical investors who are anticipating the sideways movement in the large-cap space may indicate investors will turn their attention to small-cap investments, the latter of which can offer more growth potential.
Investing in small caps can be riskier than investing in mid-cap and large-cap stocks because of the amount of due diligence that’s often required. SCAP is actively managed, using a mix of quantitative and qualitative analysis, offering traders and investors a way to diversify their portfolios without having to spend the time and take on the risk of choosing a basket of small-cap investments individually. InfraCap’s methods of selecting its holdings also provide the opportunity for the fund to outperform compared to a passive benchmark.
Read Next: Small-Cap Companies Can Offer Promise Of High Returns, But How Does One Find Winners Given The Risks Involved? A Look Inside Infracap's SCAP ETF
Trending: What's Going On With GameStop Stock?
While SCAP’s largest holding is IWM, the fund also holds smaller positions in several small-cap investments that are popular with traders. MKS Instruments, Inc (NASDAQ:MKSI) is the second largest holding within the fund, weighted at 3.03%, followed by GoDaddy, Inc (NYSE:GDDY), weighted at 2.94%, Chord Energy Corp (NASDAQ:CHRD), weighted at 2.88% and Jefferies Financial Group, Inc (NYSE:JEF) weighted at 2.86%.
Also within the top 10 holdings within SCAP are Herc Holdings, Inc (NYSE:HRI), Apollo Global Management, Inc, East West Bancorp, Inc, Coca-Cola Consolidated, Inc (NASDAQ:COKE) and Casey’s General Stores, Inc (NASDAQ:CASY).
Want direct analysis? Find me in the BZ Pro lounge! Click here for a free trial.
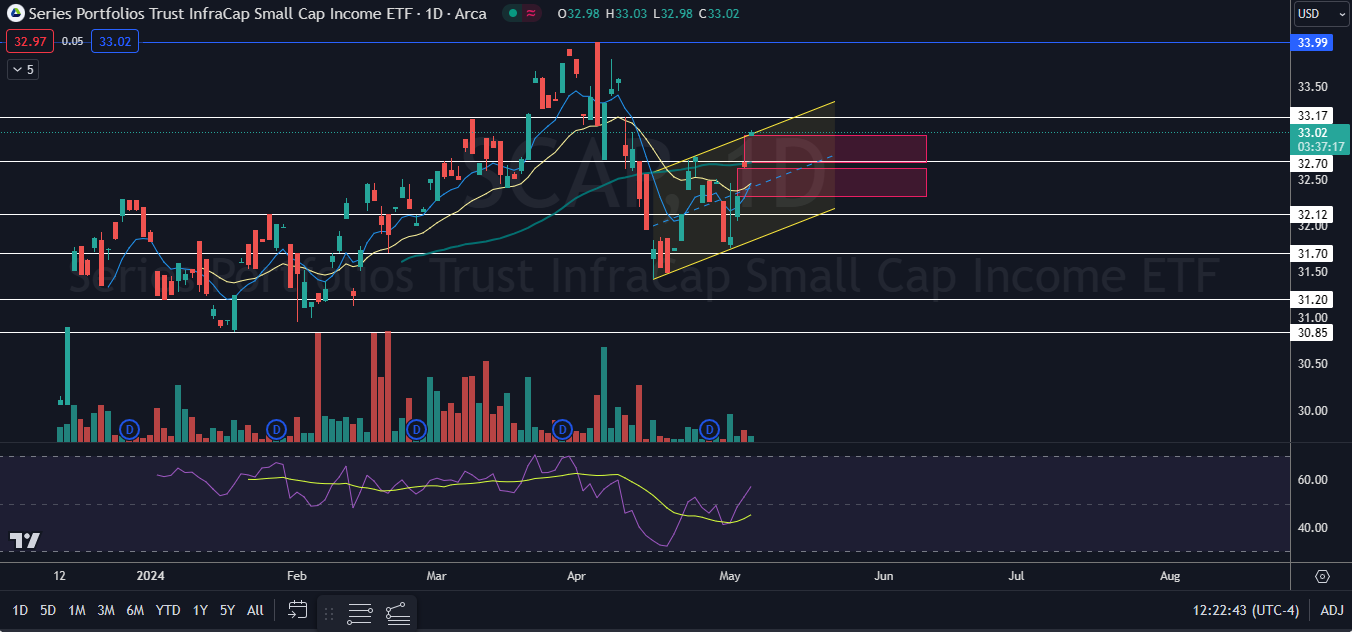
The SCAP Chart: Since it’s inception on Dec. 12, SCAP is up about 10%, despite having retraced about 3% from the April 4 all-time high of $33.99. After reaching a local low of $31.42 on April 16, SCAP reversed into an uptrend and has been making a fairly consistent series of higher highs and higher lows.
- SCAP’s most recent confirmed higher high was formed at the $32.75 mark on April 24 and the most recent higher low was printed on May 1 at $31.76. On Monday, SCAP pushed above the most recent higher high, indicating the uptrend remains intact.
- If SCAP closes Monday’s trading session near the high-of-day, the fund will form a bullish kicker candlestick, which could indicate higher prices will come again on Tuesday. If that happens, the local top may occur because the ETF will have formed a three-gap-up-reversal pattern.
- Bearish traders may choose to wait until SCAP indicates a reversal may be on the horizon, by eventually printing a bearish candlestick such as a doji or shooting star candlestick. The fund is likely to retrace toward the $32.32 mark at some point in the future to fill the two lower gaps and if that happens, SCAP is likely to bounce, at least temporarily, from the lower range of the lower gap.
- SCAP has resistance above at $33.17 and at the all-time high and support below at $32.70 and at $32.12.
- Featured image sourced from Shutterstock
Posted In: CASY CHRD COKE GDDY HRI IWM JEF MKSI SCAP