A Closer Look at 4 Analyst Recommendations For Ranpak Hldgs
Author: Benzinga Insights | May 03, 2024 01:01pm
In the last three months, 4 analysts have published ratings on Ranpak Hldgs (NYSE:PACK), offering a diverse range of perspectives from bullish to bearish.
In the table below, you'll find a summary of their recent ratings, revealing the shifting sentiments over the past 30 days and comparing them to the previous months.
|
Bullish |
Somewhat Bullish |
Indifferent |
Somewhat Bearish |
Bearish |
| Total Ratings |
2 |
2 |
0 |
0 |
0 |
| Last 30D |
0 |
1 |
0 |
0 |
0 |
| 1M Ago |
0 |
0 |
0 |
0 |
0 |
| 2M Ago |
2 |
1 |
0 |
0 |
0 |
| 3M Ago |
0 |
0 |
0 |
0 |
0 |
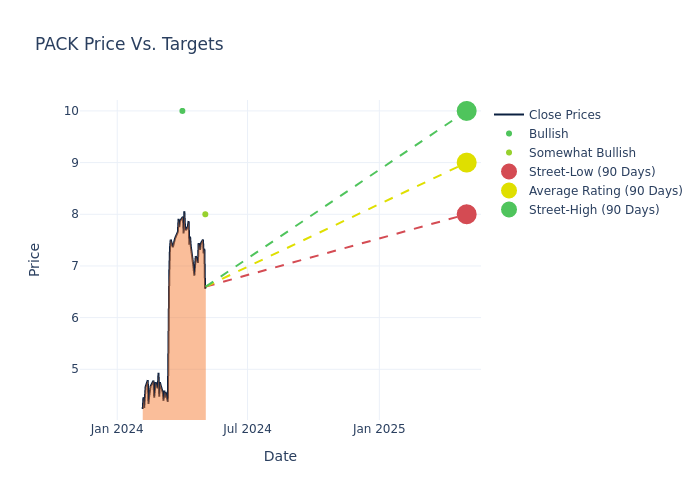
Analysts provide deeper insights through their assessments of 12-month price targets, revealing an average target of $8.25, a high estimate of $10.00, and a low estimate of $7.00. Witnessing a positive shift, the current average has risen by 26.92% from the previous average price target of $6.50.
Exploring Analyst Ratings: An In-Depth Overview
The analysis of recent analyst actions sheds light on the perception of Ranpak Hldgs by financial experts. The following summary presents key analysts, their recent evaluations, and adjustments to ratings and price targets.
| Analyst |
Analyst Firm |
Action Taken |
Rating |
Current Price Target |
Prior Price Target |
| Ghansham Panjabi |
Baird |
Raises |
Outperform |
$8.00 |
$7.00 |
| Greg Palm |
Craig-Hallum |
Raises |
Buy |
$10.00 |
$8.00 |
| Greg Palm |
Craig-Hallum |
Raises |
Buy |
$8.00 |
$6.00 |
| Ghansham Panjabi |
Baird |
Raises |
Outperform |
$7.00 |
$5.00 |
Key Insights:
- Action Taken: Analysts frequently update their recommendations based on evolving market conditions and company performance. Whether they 'Maintain', 'Raise' or 'Lower' their stance, it reflects their reaction to recent developments related to Ranpak Hldgs. This information provides a snapshot of how analysts perceive the current state of the company.
- Rating: Providing a comprehensive analysis, analysts offer qualitative assessments, ranging from 'Outperform' to 'Underperform'. These ratings reflect expectations for the relative performance of Ranpak Hldgs compared to the broader market.
- Price Targets: Gaining insights, analysts provide estimates for the future value of Ranpak Hldgs's stock. This comparison reveals trends in analysts' expectations over time.
Analyzing these analyst evaluations alongside relevant financial metrics can provide a comprehensive view of Ranpak Hldgs's market position. Stay informed and make data-driven decisions with the assistance of our Ratings Table.
Stay up to date on Ranpak Hldgs analyst ratings.
If you are interested in following small-cap stock news and performance you can start by tracking it here.
Get to Know Ranpak Hldgs Better
Ranpak Holdings Corp is a provider of environmentally sustainable, systems-based, product protection solutions for e-Commerce and industrial supply chains. The company offers a full suite of protective packaging systems and paper consumables. Geographically, it derives a majority of revenue from Europe/Asia. They generate revenue by providing its PPS systems and paper consumables to customers, which include direct end-users and our network of exclusive paper packaging solution distributors, and by providing end-of-line automation systems that solve challenges, including optimization, customization, and efficiency.
Unraveling the Financial Story of Ranpak Hldgs
Market Capitalization Perspectives: The company's market capitalization falls below industry averages, signaling a relatively smaller size compared to peers. This positioning may be influenced by factors such as perceived growth potential or operational scale.
Revenue Growth: Ranpak Hldgs's revenue growth over a period of 3 months has been noteworthy. As of 31 December, 2023, the company achieved a revenue growth rate of approximately 13.85%. This indicates a substantial increase in the company's top-line earnings. When compared to others in the Materials sector, the company excelled with a growth rate higher than the average among peers.
Net Margin: Ranpak Hldgs's net margin falls below industry averages, indicating challenges in achieving strong profitability. With a net margin of -10.29%, the company may face hurdles in effective cost management.
Return on Equity (ROE): Ranpak Hldgs's ROE falls below industry averages, indicating challenges in efficiently using equity capital. With an ROE of -1.62%, the company may face hurdles in generating optimal returns for shareholders.
Return on Assets (ROA): Ranpak Hldgs's ROA is below industry standards, pointing towards difficulties in efficiently utilizing assets. With an ROA of -0.83%, the company may encounter challenges in delivering satisfactory returns from its assets.
Debt Management: The company maintains a balanced debt approach with a debt-to-equity ratio below industry norms, standing at 0.75.
Analyst Ratings: What Are They?
Ratings come from analysts, or specialists within banking and financial systems that report for specific stocks or defined sectors (typically once per quarter for each stock). Analysts usually derive their information from company conference calls and meetings, financial statements, and conversations with important insiders to reach their decisions.
Some analysts will also offer forecasts for metrics like growth estimates, earnings, and revenue to provide further guidance on stocks. Investors who use analyst ratings should note that this specialized advice comes from humans and may be subject to error.
This article was generated by Benzinga's automated content engine and reviewed by an editor.
Posted In: PACK