A Glimpse Into The Expert Outlook On Nike Through 29 Analysts
Author: Benzinga Insights | April 30, 2024 12:00pm
Analysts' ratings for Nike (NYSE:NKE) over the last quarter vary from bullish to bearish, as provided by 29 analysts.
The table below offers a condensed view of their recent ratings, showcasing the changing sentiments over the past 30 days and comparing them to the preceding months.
|
Bullish |
Somewhat Bullish |
Indifferent |
Somewhat Bearish |
Bearish |
| Total Ratings |
7 |
14 |
7 |
0 |
1 |
| Last 30D |
0 |
1 |
0 |
0 |
0 |
| 1M Ago |
1 |
0 |
0 |
0 |
0 |
| 2M Ago |
6 |
13 |
6 |
0 |
1 |
| 3M Ago |
0 |
0 |
1 |
0 |
0 |
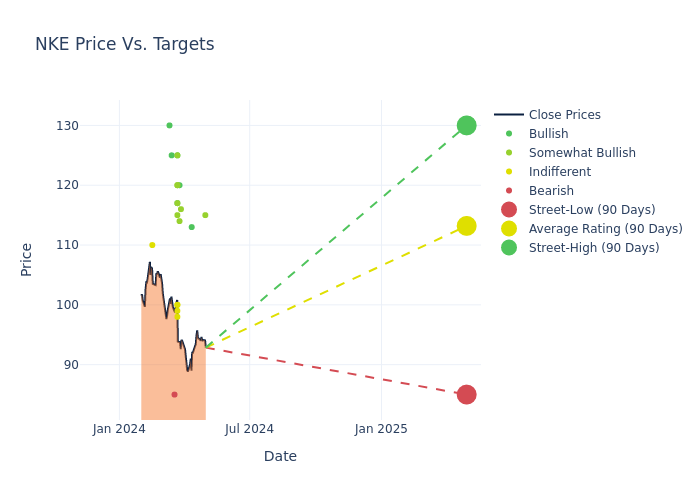
In the assessment of 12-month price targets, analysts unveil insights for Nike, presenting an average target of $114.28, a high estimate of $130.00, and a low estimate of $85.00. A decline of 7.84% from the prior average price target is evident in the current average.
Exploring Analyst Ratings: An In-Depth Overview
In examining recent analyst actions, we gain insights into how financial experts perceive Nike. The following summary outlines key analysts, their recent evaluations, and adjustments to ratings and price targets.
| Analyst |
Analyst Firm |
Action Taken |
Rating |
Current Price Target |
Prior Price Target |
| Tom Nikic |
Wedbush |
Maintains |
Outperform |
$115.00 |
- |
| Lorraine Hutchinson |
B of A Securities |
Raises |
Buy |
$113.00 |
$110.00 |
| Alex Straton |
Morgan Stanley |
Lowers |
Overweight |
$116.00 |
$124.00 |
| Tom Nikic |
Wedbush |
Maintains |
Outperform |
$115.00 |
- |
| Brooke Roach |
Goldman Sachs |
Lowers |
Buy |
$120.00 |
$135.00 |
| Adrienne Yih |
Barclays |
Lowers |
Overweight |
$114.00 |
$142.00 |
| Aneesha Sherman |
Bernstein |
Lowers |
Outperform |
$120.00 |
$134.00 |
| Jonathan Komp |
Baird |
Lowers |
Outperform |
$125.00 |
$140.00 |
| Randal Konik |
Jefferies |
Lowers |
Hold |
$100.00 |
$110.00 |
| Michael Binetti |
Evercore ISI Group |
Lowers |
Outperform |
$117.00 |
$127.00 |
| Ike Boruchow |
Wells Fargo |
Lowers |
Overweight |
$120.00 |
$125.00 |
| Abbie Zvejnieks |
Piper Sandler |
Lowers |
Neutral |
$98.00 |
$107.00 |
| Jim Duffy |
Stifel |
Lowers |
Buy |
$117.00 |
$129.00 |
| Tom Nikic |
Wedbush |
Maintains |
Outperform |
$115.00 |
- |
| Piral Dadhania |
RBC Capital |
Lowers |
Sector Perform |
$100.00 |
$110.00 |
| Joseph Civello |
Truist Securities |
Lowers |
Hold |
$99.00 |
$111.00 |
| Joseph Feldman |
Telsey Advisory Group |
Lowers |
Outperform |
$115.00 |
$120.00 |
| Jay Sole |
UBS |
Lowers |
Buy |
$125.00 |
$138.00 |
| Brooke Roach |
Goldman Sachs |
Lowers |
Buy |
$120.00 |
$135.00 |
| Beth Reed |
Truist Securities |
Maintains |
Hold |
$111.00 |
$111.00 |
| Tom Nikic |
Wedbush |
Lowers |
Outperform |
$115.00 |
$131.00 |
| Lorraine Hutchinson |
B of A Securities |
Lowers |
Neutral |
$120.00 |
$125.00 |
| Sam Poser |
Williams Trading |
Lowers |
Sell |
$85.00 |
$92.00 |
| Joseph Feldman |
Telsey Advisory Group |
Lowers |
Outperform |
$120.00 |
$140.00 |
| Paul Lejuez |
Citigroup |
Lowers |
Buy |
$125.00 |
$135.00 |
| Piral Dadhania |
RBC Capital |
Lowers |
Outperform |
$110.00 |
$120.00 |
| Alex Straton |
Morgan Stanley |
Lowers |
Overweight |
$124.00 |
$125.00 |
| Robert Drbul |
Guggenheim |
Announces |
Buy |
$130.00 |
- |
| Brian Nagel |
Oppenheimer |
Announces |
Perform |
$110.00 |
- |
Key Insights:
- Action Taken: Analysts frequently update their recommendations based on evolving market conditions and company performance. Whether they 'Maintain', 'Raise' or 'Lower' their stance, it reflects their reaction to recent developments related to Nike. This information provides a snapshot of how analysts perceive the current state of the company.
- Rating: Providing a comprehensive analysis, analysts offer qualitative assessments, ranging from 'Outperform' to 'Underperform'. These ratings reflect expectations for the relative performance of Nike compared to the broader market.
- Price Targets: Understanding forecasts, analysts offer estimates for Nike's future value. Examining the current and prior targets provides insight into analysts' changing expectations.
Assessing these analyst evaluations alongside crucial financial indicators can provide a comprehensive overview of Nike's market position. Stay informed and make well-judged decisions with the assistance of our Ratings Table.
Stay up to date on Nike analyst ratings.
Unveiling the Story Behind Nike
Nike is the largest athletic footwear and apparel brand in the world. Key categories include basketball, running, and football (soccer). Footwear generates about two thirds of its sales. Its brands include Nike, Jordan, and Converse (casual footwear). Nike sells products worldwide through company-owned stores, franchised stores, and third-party retailers. The firm also operates e-commerce platforms in more than 40 countries. Nearly all its production is outsourced to contract manufacturers in more than 30 countries. Nike was founded in 1964 and is based in Beaverton, Oregon.
Unraveling the Financial Story of Nike
Market Capitalization Analysis: With an elevated market capitalization, the company stands out above industry averages, showcasing substantial size and market acknowledgment.
Revenue Growth: Over the 3 months period, Nike showcased positive performance, achieving a revenue growth rate of 0.31% as of 29 February, 2024. This reflects a substantial increase in the company's top-line earnings. As compared to competitors, the company encountered difficulties, with a growth rate lower than the average among peers in the Consumer Discretionary sector.
Net Margin: Nike's net margin surpasses industry standards, highlighting the company's exceptional financial performance. With an impressive 9.43% net margin, the company effectively manages costs and achieves strong profitability.
Return on Equity (ROE): Nike's ROE surpasses industry standards, highlighting the company's exceptional financial performance. With an impressive 8.26% ROE, the company effectively utilizes shareholder equity capital.
Return on Assets (ROA): The company's ROA is a standout performer, exceeding industry averages. With an impressive ROA of 3.14%, the company showcases effective utilization of assets.
Debt Management: The company maintains a balanced debt approach with a debt-to-equity ratio below industry norms, standing at 0.85.
The Significance of Analyst Ratings Explained
Benzinga tracks 150 analyst firms and reports on their stock expectations. Analysts typically arrive at their conclusions by predicting how much money a company will make in the future, usually the upcoming five years, and how risky or predictable that company's revenue streams are.
Analysts attend company conference calls and meetings, research company financial statements, and communicate with insiders to publish their ratings on stocks. Analysts typically rate each stock once per quarter or whenever the company has a major update.
Some analysts publish their predictions for metrics such as growth estimates, earnings, and revenue to provide additional guidance with their ratings. When using analyst ratings, it is important to keep in mind that stock and sector analysts are also human and are only offering their opinions to investors.
This article was generated by Benzinga's automated content engine and reviewed by an editor.
Posted In: NKE