Comparing Amazon.com With Industry Competitors In Broadline Retail Industry
Author: Benzinga Insights | April 26, 2024 11:00am
In today's rapidly evolving and fiercely competitive business landscape, it is crucial for investors and industry analysts to conduct comprehensive company evaluations. In this article, we will undertake an in-depth industry comparison, assessing Amazon.com (NASDAQ:AMZN) alongside its primary competitors in the Broadline Retail industry. By meticulously examining crucial financial indicators, market positioning, and growth potential, we aim to provide valuable insights to investors and shed light on company's performance within the industry.
Amazon.com Background
Amazon is a leading online retailer and one of the highest-grossing e-commerce aggregators, with $386 billion in net sales and approximately $578 billion in estimated physical/digital online gross merchandise volume in 2021. Retail-related revenue represents approximately 80% of the total, followed by Amazon Web Services' cloud computing, storage, database, and other offerings (10%-15%), advertising services (5%), and other. International segments constitute 25%-30% of Amazon's non-AWS sales, led by Germany, the United Kingdom, and Japan.
| Company |
P/E |
P/B |
P/S |
ROE |
EBITDA (in billions) |
Gross Profit (in billions) |
Revenue Growth |
| Amazon.com Inc |
59.89 |
8.95 |
3.17 |
5.52% |
$28.22 |
$29.27 |
13.91% |
| Alibaba Group Holding Ltd |
14.06 |
1.31 |
1.51 |
1.41% |
$37.55 |
$104.13 |
5.08% |
| PDD Holdings Inc |
22.15 |
6.76 |
5.37 |
13.33% |
$26.88 |
$53.8 |
29.11% |
| MercadoLibre Inc |
70.08 |
22.51 |
4.81 |
5.68% |
$0.45 |
$1.96 |
41.94% |
| JD.com Inc |
13.61 |
1.37 |
0.30 |
1.47% |
$4.23 |
$43.5 |
3.6% |
| Coupang Inc |
30.71 |
10.04 |
1.70 |
29.43% |
$0.26 |
$1.68 |
23.16% |
| eBay Inc |
9.85 |
4.16 |
2.71 |
11.78% |
$1.34 |
$1.85 |
2.07% |
| Vipshop Holdings Ltd |
7.91 |
1.67 |
0.57 |
8.35% |
$3.79 |
$8.23 |
9.18% |
| Dillard's Inc |
9.96 |
4.26 |
1.07 |
14.27% |
$0.36 |
$0.81 |
-0.17% |
| Macy's Inc |
48.29 |
1.22 |
0.21 |
-1.69% |
$0.16 |
$3.3 |
-2.42% |
| Ollie's Bargain Outlet Holdings Inc |
25.46 |
3.03 |
2.19 |
5.19% |
$0.11 |
$0.26 |
18.04% |
| Nordstrom Inc |
23.17 |
3.66 |
0.21 |
16.99% |
$0.46 |
$1.6 |
2.34% |
| Savers Value Village Inc |
50.24 |
7.35 |
1.78 |
12.73% |
$0.06 |
$0.22 |
4.35% |
| Kohl's Corp |
8.52 |
0.69 |
0.15 |
4.87% |
$0.49 |
$2.1 |
-1.05% |
| D-MARKET Electronic Services & Trading |
11.59 |
3.98 |
0.67 |
-5.6% |
$0.79 |
$2.41 |
52.02% |
| Average |
24.69 |
5.14 |
1.66 |
8.44% |
$5.5 |
$16.13 |
13.37% |
By conducting an in-depth analysis of Amazon.com, we can identify the following trends:
-
At 59.89, the stock's Price to Earnings ratio significantly exceeds the industry average by 2.43x, suggesting a premium valuation relative to industry peers.
-
It could be trading at a premium in relation to its book value, as indicated by its Price to Book ratio of 8.95 which exceeds the industry average by 1.74x.
-
With a relatively high Price to Sales ratio of 3.17, which is 1.91x the industry average, the stock might be considered overvalued based on sales performance.
-
The company has a lower Return on Equity (ROE) of 5.52%, which is 2.92% below the industry average. This indicates potential inefficiency in utilizing equity to generate profits, which could be attributed to various factors.
-
The company exhibits higher Earnings Before Interest, Taxes, Depreciation, and Amortization (EBITDA) of $28.22 Billion, which is 5.13x above the industry average, implying stronger profitability and robust cash flow generation.
-
With higher gross profit of $29.27 Billion, which indicates 1.81x above the industry average, the company demonstrates stronger profitability and higher earnings from its core operations.
-
The company's revenue growth of 13.91% exceeds the industry average of 13.37%, indicating strong sales performance and market outperformance.
Debt To Equity Ratio
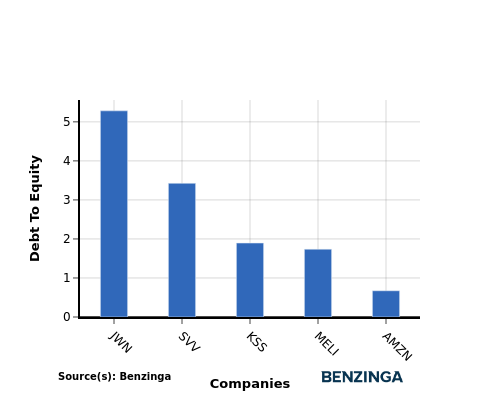
The debt-to-equity (D/E) ratio provides insights into the proportion of debt a company has in relation to its equity and asset value.
Considering the debt-to-equity ratio in industry comparisons allows for a concise evaluation of a company's financial health and risk profile, aiding in informed decision-making.
By evaluating Amazon.com against its top 4 peers in terms of the Debt-to-Equity ratio, the following observations arise:
-
Among its top 4 peers, Amazon.com has a stronger financial position with a lower debt-to-equity ratio of 0.67.
-
This indicates that the company relies less on debt financing and maintains a more favorable balance between debt and equity, which can be viewed positively by investors.
Key Takeaways
The high P/E, P/B, and P/S ratios of Amazon.com indicate that the market values the company's earnings, book value, and sales at a premium compared to its peers in the Broadline Retail industry. However, the low ROE suggests that Amazon.com is less efficient in generating profits from shareholders' equity. On the other hand, the high EBITDA, gross profit, and revenue growth reflect strong operational performance and growth potential relative to industry competitors.
This article was generated by Benzinga's automated content engine and reviewed by an editor.
Posted In: AMZN


