Competitor Analysis: Evaluating Meta Platforms And Competitors In Interactive Media & Services Industry
Author: Benzinga Insights | April 26, 2024 11:00am
In the dynamic and cutthroat world of business, conducting thorough company analysis is essential for investors and industry experts. In this article, we will undertake a comprehensive industry comparison, evaluating Meta Platforms (NASDAQ:META) and its primary competitors in the Interactive Media & Services industry. By closely examining key financial metrics, market position, and growth prospects, our aim is to provide valuable insights for investors and shed light on company's performance within the industry.
Meta Platforms Background
Meta is the world's largest online social network, with nearly 4 billion family of apps monthly active users. Users engage with each other in different ways, exchanging messages and sharing news events, photos, and videos. The firm's ecosystem consists mainly of the Facebook app, Instagram, Messenger, WhatsApp, and many features surrounding these products. Users can access Facebook on mobile devices and desktops. Advertising revenue represents more than 90% of the firm's total revenue, with more than 45% coming from the US and Canada and over 20% from Europe.
| Company |
P/E |
P/B |
P/S |
ROE |
EBITDA (in billions) |
Gross Profit (in billions) |
Revenue Growth |
| Meta Platforms Inc |
25.40 |
7.49 |
8.15 |
9.47% |
$20.11 |
$32.42 |
24.7% |
| Alphabet Inc |
26.90 |
6.84 |
6.46 |
7.43% |
$26.04 |
$48.73 |
13.49% |
| Baidu Inc |
13.13 |
1.04 |
1.91 |
0.77% |
$3.64 |
$17.53 |
5.67% |
| Kanzhun Ltd |
109.25 |
4.66 |
11.74 |
3.23% |
$0.26 |
$1.34 |
36.32% |
| ZoomInfo Technologies Inc |
58.22 |
2.80 |
5.04 |
-0.25% |
$0.24 |
$0.27 |
4.91% |
| IAC Inc |
16.20 |
0.68 |
0.95 |
5.39% |
$0.64 |
$0.75 |
-15.12% |
| Tripadvisor Inc |
374.86 |
4.15 |
2.13 |
3.78% |
$0.07 |
$0.35 |
10.17% |
| Yelp Inc |
29.61 |
3.64 |
2.20 |
3.68% |
$0.04 |
$0.31 |
10.76% |
| CarGurus Inc |
120.58 |
3.99 |
2.86 |
-3.56% |
$-0.01 |
$0.17 |
-22.19% |
| Ziff Davis Inc |
57.39 |
1.24 |
1.74 |
3.43% |
$0.15 |
$0.34 |
-1.72% |
| Weibo Corp |
5.90 |
0.60 |
1.15 |
2.45% |
$0.13 |
$0.35 |
-2.52% |
| Getty Images Holdings Inc |
78 |
2.52 |
1.75 |
6.56% |
$0.03 |
$0.16 |
-2.39% |
| Shutterstock Inc |
13.88 |
2.84 |
1.75 |
-0.19% |
$0.02 |
$0.12 |
-0.23% |
| Average |
75.33 |
2.92 |
3.31 |
2.73% |
$2.6 |
$5.87 |
3.1% |
Upon closer analysis of Meta Platforms, the following trends become apparent:
-
The stock's Price to Earnings ratio of 25.4 is lower than the industry average by 0.34x, suggesting potential value in the eyes of market participants.
-
The elevated Price to Book ratio of 7.49 relative to the industry average by 2.57x suggests company might be overvalued based on its book value.
-
The Price to Sales ratio of 8.15, which is 2.46x the industry average, suggests the stock could potentially be overvalued in relation to its sales performance compared to its peers.
-
The Return on Equity (ROE) of 9.47% is 6.74% above the industry average, highlighting efficient use of equity to generate profits.
-
With higher Earnings Before Interest, Taxes, Depreciation, and Amortization (EBITDA) of $20.11 Billion, which is 7.73x above the industry average, the company demonstrates stronger profitability and robust cash flow generation.
-
With higher gross profit of $32.42 Billion, which indicates 5.52x above the industry average, the company demonstrates stronger profitability and higher earnings from its core operations.
-
The company's revenue growth of 24.7% is notably higher compared to the industry average of 3.1%, showcasing exceptional sales performance and strong demand for its products or services.
Debt To Equity Ratio
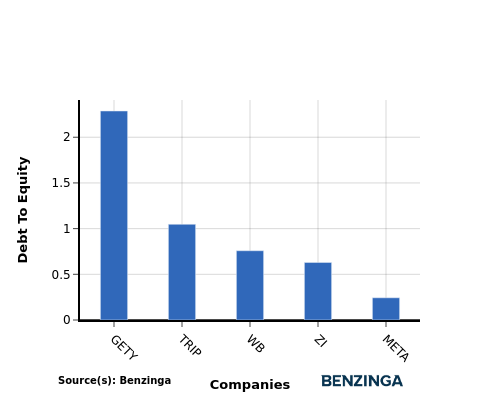
The debt-to-equity (D/E) ratio is an important measure to assess the financial structure and risk profile of a company.
Considering the debt-to-equity ratio in industry comparisons allows for a concise evaluation of a company's financial health and risk profile, aiding in informed decision-making.
By considering the Debt-to-Equity ratio, Meta Platforms can be compared to its top 4 peers, leading to the following observations:
-
When considering the debt-to-equity ratio, Meta Platforms exhibits a stronger financial position compared to its top 4 peers.
-
This indicates that the company has a favorable balance between debt and equity, with a lower debt-to-equity ratio of 0.24, which can be perceived as a positive aspect by investors.
Key Takeaways
The PE, PB, and PS ratios for Meta Platforms indicate that it may be undervalued compared to its peers in the Interactive Media & Services industry. On the other hand, Meta Platforms shows strong performance in terms of ROE, EBITDA, gross profit, and revenue growth, suggesting a competitive position within the industry.
This article was generated by Benzinga's automated content engine and reviewed by an editor.
Posted In: META


