Demystifying Hub Group: Insights From 9 Analyst Reviews
Author: Benzinga Insights | April 26, 2024 10:00am
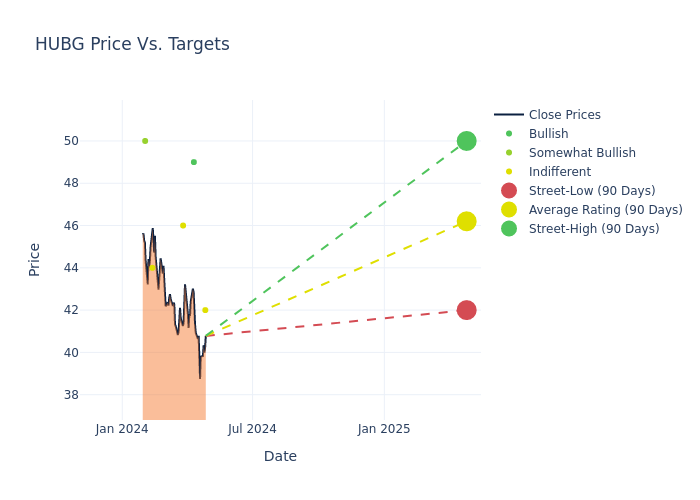
Ratings for Hub Group (NASDAQ:HUBG) were provided by 9 analysts in the past three months, showcasing a mix of bullish and bearish perspectives.
The following table encapsulates their recent ratings, offering a glimpse into the evolving sentiments over the past 30 days and comparing them to the preceding months.
|
Bullish |
Somewhat Bullish |
Indifferent |
Somewhat Bearish |
Bearish |
| Total Ratings |
1 |
1 |
7 |
0 |
0 |
| Last 30D |
0 |
0 |
1 |
0 |
0 |
| 1M Ago |
1 |
0 |
1 |
0 |
0 |
| 2M Ago |
0 |
0 |
2 |
0 |
0 |
| 3M Ago |
0 |
1 |
3 |
0 |
0 |
Insights from analysts' 12-month price targets are revealed, presenting an average target of $43.47, a high estimate of $50.00, and a low estimate of $21.25. Observing a downward trend, the current average is 16.9% lower than the prior average price target of $52.31.
Investigating Analyst Ratings: An Elaborate Study
The standing of Hub Group among financial experts is revealed through an in-depth exploration of recent analyst actions. The summary below outlines key analysts, their recent evaluations, and adjustments to ratings and price targets.
| Analyst |
Analyst Firm |
Action Taken |
Rating |
Current Price Target |
Prior Price Target |
| Justin Long |
Stephens & Co. |
Lowers |
Equal-Weight |
$42.00 |
$44.00 |
| Christopher Kuhn |
Benchmark |
Maintains |
Buy |
$49.00 |
- |
| Justin Long |
Stephens & Co. |
Lowers |
Equal-Weight |
$44.00 |
$49.00 |
| Bascome Majors |
Susquehanna |
Lowers |
Neutral |
$46.00 |
$49.00 |
| Bascome Majors |
Susquehanna |
Lowers |
Neutral |
$46.00 |
$49.00 |
| Ravi Shanker |
Morgan Stanley |
Raises |
Equal-Weight |
$44.00 |
$43.00 |
| Allison Poliniak |
Wells Fargo |
Raises |
Overweight |
$50.00 |
$45.00 |
| Bascome Majors |
Susquehanna |
Lowers |
Neutral |
$49.00 |
$97.00 |
| Ravi Shanker |
Morgan Stanley |
Lowers |
Equal-Weight |
$21.25 |
$42.50 |
Key Insights:
- Action Taken: In response to dynamic market conditions and company performance, analysts update their recommendations. Whether they 'Maintain', 'Raise', or 'Lower' their stance, it signifies their reaction to recent developments related to Hub Group. This insight gives a snapshot of analysts' perspectives on the current state of the company.
- Rating: Unveiling insights, analysts deliver qualitative insights into stock performance, from 'Outperform' to 'Underperform'. These ratings convey expectations for the relative performance of Hub Group compared to the broader market.
- Price Targets: Analysts navigate through adjustments in price targets, providing estimates for Hub Group's future value. Comparing current and prior targets offers insights into analysts' evolving expectations.
Considering these analyst evaluations in conjunction with other financial indicators can offer a comprehensive understanding of Hub Group's market position. Stay informed and make well-informed decisions with our Ratings Table.
Stay up to date on Hub Group analyst ratings.
Delving into Hub Group's Background
Hub Group ranks among the largest providers of rail intermodal service. Roughly 60% of revenue comes from Hub's intermodal and transportation solutions division. ITS includes its flagship intermodal operations, which use the Class I rail carriers for the underlying line-haul movement of containers, as well as its dedicated truckload shipping unit. Hub's logistics segment includes its asset light truck brokerage operations, along with its outsourced transportation management, warehousing and fulfillment, and heavy-goods final mile delivery offerings. Hub is somewhat acquisitive in that it often makes tuck-in acquisitions which expand its brokerage, last-mile, and dedicated offerings.
Financial Insights: Hub Group
Market Capitalization Analysis: Below industry benchmarks, the company's market capitalization reflects a smaller scale relative to peers. This could be attributed to factors such as growth expectations or operational capacity.
Decline in Revenue: Over the 3 months period, Hub Group faced challenges, resulting in a decline of approximately -23.37% in revenue growth as of 31 December, 2023. This signifies a reduction in the company's top-line earnings. As compared to its peers, the revenue growth lags behind its industry peers. The company achieved a growth rate lower than the average among peers in Industrials sector.
Net Margin: Hub Group's financial strength is reflected in its exceptional net margin, which exceeds industry averages. With a remarkable net margin of 2.92%, the company showcases strong profitability and effective cost management.
Return on Equity (ROE): Hub Group's ROE stands out, surpassing industry averages. With an impressive ROE of 1.76%, the company demonstrates effective use of equity capital and strong financial performance.
Return on Assets (ROA): Hub Group's ROA stands out, surpassing industry averages. With an impressive ROA of 0.98%, the company demonstrates effective utilization of assets and strong financial performance.
Debt Management: Hub Group's debt-to-equity ratio is below industry norms, indicating a sound financial structure with a ratio of 0.35.
Analyst Ratings: Simplified
Ratings come from analysts, or specialists within banking and financial systems that report for specific stocks or defined sectors (typically once per quarter for each stock). Analysts usually derive their information from company conference calls and meetings, financial statements, and conversations with important insiders to reach their decisions.
Some analysts publish their predictions for metrics such as growth estimates, earnings, and revenue to provide additional guidance with their ratings. When using analyst ratings, it is important to keep in mind that stock and sector analysts are also human and are only offering their opinions to investors.
If you want to keep track of which analysts are outperforming others, you can view updated analyst ratings along withanalyst success scores in Benzinga Pro.
This article was generated by Benzinga's automated content engine and reviewed by an editor.
Posted In: HUBG