The Analyst Landscape: 5 Takes On SLM
Author: Benzinga Insights | April 25, 2024 04:00pm
Across the recent three months, 5 analysts have shared their insights on SLM (NASDAQ:SLM), expressing a variety of opinions spanning from bullish to bearish.
The table below provides a concise overview of recent ratings by analysts, offering insights into the changing sentiments over the past 30 days and drawing comparisons with the preceding months for a holistic perspective.
|
Bullish |
Somewhat Bullish |
Indifferent |
Somewhat Bearish |
Bearish |
| Total Ratings |
0 |
3 |
2 |
0 |
0 |
| Last 30D |
0 |
2 |
1 |
0 |
0 |
| 1M Ago |
0 |
1 |
1 |
0 |
0 |
| 2M Ago |
0 |
0 |
0 |
0 |
0 |
| 3M Ago |
0 |
0 |
0 |
0 |
0 |
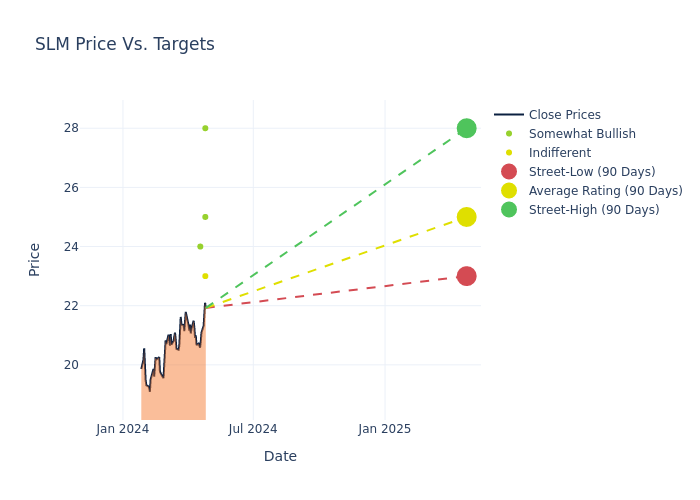
Analysts' evaluations of 12-month price targets offer additional insights, showcasing an average target of $24.4, with a high estimate of $28.00 and a low estimate of $22.00. Witnessing a positive shift, the current average has risen by 7.02% from the previous average price target of $22.80.
Analyzing Analyst Ratings: A Detailed Breakdown
The analysis of recent analyst actions sheds light on the perception of SLM by financial experts. The following summary presents key analysts, their recent evaluations, and adjustments to ratings and price targets.
| Analyst |
Analyst Firm |
Action Taken |
Rating |
Current Price Target |
Prior Price Target |
| Richard Shane |
JP Morgan |
Raises |
Neutral |
$23.00 |
$22.00 |
| Jon Arfstrom |
RBC Capital |
Raises |
Outperform |
$25.00 |
$24.00 |
| David Chiaverini |
Wedbush |
Raises |
Outperform |
$28.00 |
$26.00 |
| Michael Kaye |
Wells Fargo |
Raises |
Overweight |
$24.00 |
$22.00 |
| Richard Shane |
JP Morgan |
Raises |
Neutral |
$22.00 |
$20.00 |
Key Insights:
- Action Taken: Analysts respond to changes in market conditions and company performance, frequently updating their recommendations. Whether they 'Maintain', 'Raise' or 'Lower' their stance, it reflects their reaction to recent developments related to SLM. This information offers a snapshot of how analysts perceive the current state of the company.
- Rating: Delving into assessments, analysts assign qualitative values, from 'Outperform' to 'Underperform'. These ratings communicate expectations for the relative performance of SLM compared to the broader market.
- Price Targets: Analysts explore the dynamics of price targets, providing estimates for the future value of SLM's stock. This examination reveals shifts in analysts' expectations over time.
Analyzing these analyst evaluations alongside relevant financial metrics can provide a comprehensive view of SLM's market position. Stay informed and make data-driven decisions with the assistance of our Ratings Table.
Stay up to date on SLM analyst ratings.
Unveiling the Story Behind SLM
SLM Corp is the largest student lender in the country. It makes and holds student loans through the guaranteed Federal Family Education Loan Program as well as through private channels. It also engages in debt-management operations, including accounts receivable and collections services, and runs college savings programs.
Breaking Down SLM's Financial Performance
Market Capitalization Analysis: The company exhibits a lower market capitalization profile, positioning itself below industry averages. This suggests a smaller scale relative to peers.
Revenue Growth: SLM's revenue growth over a period of 3 months has been noteworthy. As of 31 December, 2023, the company achieved a revenue growth rate of approximately 29.99%. This indicates a substantial increase in the company's top-line earnings. When compared to others in the Financials sector, the company excelled with a growth rate higher than the average among peers.
Net Margin: SLM's net margin excels beyond industry benchmarks, reaching 36.96%. This signifies efficient cost management and strong financial health.
Return on Equity (ROE): SLM's ROE surpasses industry standards, highlighting the company's exceptional financial performance. With an impressive 10.3% ROE, the company effectively utilizes shareholder equity capital.
Return on Assets (ROA): SLM's financial strength is reflected in its exceptional ROA, which exceeds industry averages. With a remarkable ROA of 0.56%, the company showcases efficient use of assets and strong financial health.
Debt Management: SLM's debt-to-equity ratio is notably higher than the industry average. With a ratio of 3.21, the company relies more heavily on borrowed funds, indicating a higher level of financial risk.
Analyst Ratings: Simplified
Benzinga tracks 150 analyst firms and reports on their stock expectations. Analysts typically arrive at their conclusions by predicting how much money a company will make in the future, usually the upcoming five years, and how risky or predictable that company's revenue streams are.
Analysts attend company conference calls and meetings, research company financial statements, and communicate with insiders to publish their ratings on stocks. Analysts typically rate each stock once per quarter or whenever the company has a major update.
Some analysts publish their predictions for metrics such as growth estimates, earnings, and revenue to provide additional guidance with their ratings. When using analyst ratings, it is important to keep in mind that stock and sector analysts are also human and are only offering their opinions to investors.
If you want to keep track of which analysts are outperforming others, you can view updated analyst ratings along withanalyst success scores in Benzinga Pro.
This article was generated by Benzinga's automated content engine and reviewed by an editor.
Posted In: SLM