Spotlight on Home Depot: Analyzing the Surge in Options Activity
Author: Benzinga Insights | April 25, 2024 11:01am
Investors with a lot of money to spend have taken a bearish stance on Home Depot (NYSE:HD).
And retail traders should know.
We noticed this today when the trades showed up on publicly available options history that we track here at Benzinga.
Whether these are institutions or just wealthy individuals, we don't know. But when something this big happens with HD, it often means somebody knows something is about to happen.
So how do we know what these investors just did?
Today, Benzinga's options scanner spotted 12 uncommon options trades for Home Depot.
This isn't normal.
The overall sentiment of these big-money traders is split between 8% bullish and 50%, bearish.
Out of all of the special options we uncovered, 6 are puts, for a total amount of $1,159,613, and 6 are calls, for a total amount of $224,955.
Projected Price Targets
After evaluating the trading volumes and Open Interest, it's evident that the major market movers are focusing on a price band between $325.0 and $420.0 for Home Depot, spanning the last three months.
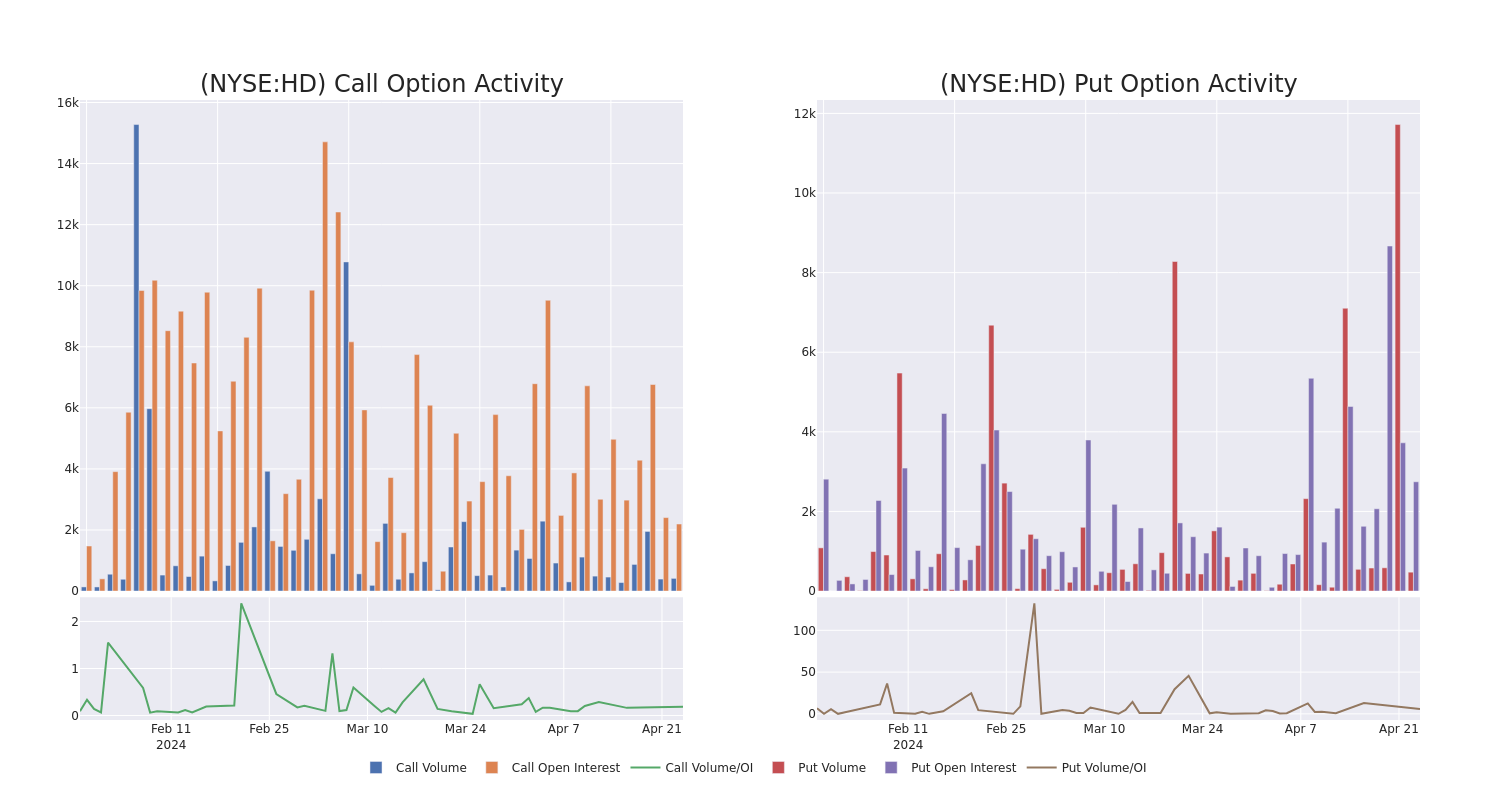
Analyzing Volume & Open Interest
Examining the volume and open interest provides crucial insights into stock research. This information is key in gauging liquidity and interest levels for Home Depot's options at certain strike prices. Below, we present a snapshot of the trends in volume and open interest for calls and puts across Home Depot's significant trades, within a strike price range of $325.0 to $420.0, over the past month.
Home Depot Option Volume And Open Interest Over Last 30 Days
Largest Options Trades Observed:
| Symbol |
PUT/CALL |
Trade Type |
Sentiment |
Exp. Date |
Ask |
Bid |
Price |
Strike Price |
Total Trade Price |
Open Interest |
Volume |
| HD |
PUT |
SWEEP |
BEARISH |
06/21/24 |
$19.55 |
$18.95 |
$18.95 |
$340.00 |
$847.1K |
4.7K |
0 |
| HD |
PUT |
TRADE |
NEUTRAL |
05/10/24 |
$28.35 |
$26.65 |
$27.63 |
$357.50 |
$138.1K |
0 |
70 |
| HD |
CALL |
SWEEP |
NEUTRAL |
07/19/24 |
$14.9 |
$14.65 |
$14.75 |
$330.00 |
$66.3K |
68 |
108 |
| HD |
PUT |
TRADE |
NEUTRAL |
05/10/24 |
$30.25 |
$28.65 |
$29.45 |
$357.50 |
$58.9K |
0 |
0 |
| HD |
PUT |
SWEEP |
BEARISH |
05/17/24 |
$17.7 |
$17.25 |
$17.7 |
$345.00 |
$56.6K |
2.9K |
3 |
About Home Depot
Home Depot is the world's largest home improvement specialty retailer, operating more than 2,300 warehouse-format stores offering more than 30,000 products in store and 1 million products online in the United States, Canada, and Mexico. Its stores offer numerous building materials, home improvement products, lawn and garden products, and decor products and provide various services, including home improvement installation services and tool and equipment rentals. The acquisition of distributor Interline Brands in 2015 allowed Home Depot to enter the maintenance, repair, and operations business, which has been expanded through the tie-up with HD Supply (2020). Moreover, the additions of the Company Store brought textile exposure to the lineup, while Redi Carpet added multifamily flooring.
After a thorough review of the options trading surrounding Home Depot, we move to examine the company in more detail. This includes an assessment of its current market status and performance.
Present Market Standing of Home Depot
- With a volume of 869,240, the price of HD is down -0.89% at $330.05.
- RSI indicators hint that the underlying stock may be oversold.
- Next earnings are expected to be released in 19 days.
What Analysts Are Saying About Home Depot
In the last month, 5 experts released ratings on this stock with an average target price of $398.0.
- In a cautious move, an analyst from HSBC downgraded its rating to Reduce, setting a price target of $323.
- Maintaining their stance, an analyst from Truist Securities continues to hold a Buy rating for Home Depot, targeting a price of $417.
- An analyst from Evercore ISI Group has decided to maintain their Outperform rating on Home Depot, which currently sits at a price target of $415.
- Consistent in their evaluation, an analyst from Evercore ISI Group keeps a Outperform rating on Home Depot with a target price of $425.
- An analyst from Wedbush persists with their Outperform rating on Home Depot, maintaining a target price of $410.
Trading options involves greater risks but also offers the potential for higher profits. Savvy traders mitigate these risks through ongoing education, strategic trade adjustments, utilizing various indicators, and staying attuned to market dynamics. Keep up with the latest options trades for Home Depot with Benzinga Pro for real-time alerts.
Posted In: HD