Evaluating Lululemon Athletica Against Peers In Textiles, Apparel & Luxury Goods Industry
Author: Benzinga Insights | April 25, 2024 11:01am
In today's fast-paced and competitive business landscape, it is essential for investors and industry enthusiasts to thoroughly analyze companies before making investment decisions. In this article, we will conduct a comprehensive industry comparison, evaluating Lululemon Athletica (NASDAQ:LULU) against its key competitors in the Textiles, Apparel & Luxury Goods industry. By examining key financial metrics, market position, and growth prospects, we aim to provide valuable insights for investors and shed light on company's performance within the industry.
Lululemon Athletica Background
Lululemon Athletica designs, distributes, and markets athletic apparel, footwear, and accessories for women, men, and girls. Lululemon offers pants, shorts, tops, and jackets for both leisure and athletic activities such as yoga and running. The company also sells fitness accessories, such as bags, yoga mats, and equipment. Lululemon sells its products through more than 700 company-owned stores in about 20 countries, e-commerce, outlets, and wholesale accounts. The company was founded in 1998 and is based in Vancouver, Canada.
| Company |
P/E |
P/B |
P/S |
ROE |
EBITDA (in billions) |
Gross Profit (in billions) |
Revenue Growth |
| Lululemon Athletica Inc |
29.88 |
10.86 |
4.82 |
17.26% |
$1.02 |
$1.9 |
15.63% |
| Ralph Lauren Corp |
19.07 |
4.18 |
1.71 |
11.2% |
$0.4 |
$1.29 |
5.55% |
| Tapestry Inc |
10.08 |
3.45 |
1.40 |
12.7% |
$0.49 |
$1.49 |
2.92% |
| Levi Strauss & Co |
71.90 |
4.34 |
1.43 |
-0.53% |
$0.04 |
$0.91 |
-7.77% |
| PVH Corp |
10.49 |
1.27 |
0.76 |
5.34% |
$0.44 |
$1.5 |
0.05% |
| Columbia Sportswear Co |
19.51 |
2.45 |
1.41 |
4.87% |
$0.17 |
$0.54 |
-9.37% |
| Capri Holdings Ltd |
18.44 |
2.13 |
0.80 |
5.46% |
$0.17 |
$0.93 |
-5.62% |
| Kontoor Brands Inc |
15.24 |
9.27 |
1.35 |
19.12% |
$0.09 |
$0.28 |
-8.45% |
| Under Armour Inc |
7.43 |
1.32 |
0.52 |
5.36% |
$0.11 |
$0.67 |
-6.05% |
| Carter's Inc |
11.64 |
3.15 |
0.90 |
12.82% |
$0.16 |
$0.42 |
-5.95% |
| Oxford Industries Inc |
28.08 |
2.99 |
1.09 |
-10.11% |
$-0.06 |
$0.25 |
5.74% |
| G-III Apparel Group Ltd |
7.75 |
0.85 |
0.44 |
1.89% |
$0.05 |
$0.28 |
-10.49% |
| FIGS Inc |
40.17 |
2.17 |
1.61 |
2.73% |
$0.02 |
$0.1 |
0.01% |
| Movado Group Inc |
12.72 |
1.12 |
0.88 |
2.39% |
$0.02 |
$0.1 |
-7.54% |
| Superior Group Of Companies Inc |
31.19 |
1.42 |
0.50 |
1.81% |
$0.01 |
$0.06 |
-0.92% |
| Vera Bradley Inc |
27.24 |
0.81 |
0.45 |
-0.71% |
$0.01 |
$0.07 |
-9.4% |
| Lakeland Industries Inc |
23.46 |
1.01 |
1.02 |
-0.79% |
$0.0 |
$0.01 |
7.73% |
| Average |
22.15 |
2.62 |
1.02 |
4.6% |
$0.13 |
$0.56 |
-3.1% |
By carefully studying Lululemon Athletica, we can deduce the following trends:
-
At 29.88, the stock's Price to Earnings ratio significantly exceeds the industry average by 1.35x, suggesting a premium valuation relative to industry peers.
-
It could be trading at a premium in relation to its book value, as indicated by its Price to Book ratio of 10.86 which exceeds the industry average by 4.15x.
-
The stock's relatively high Price to Sales ratio of 4.82, surpassing the industry average by 4.73x, may indicate an aspect of overvaluation in terms of sales performance.
-
With a Return on Equity (ROE) of 17.26% that is 12.66% above the industry average, it appears that the company exhibits efficient use of equity to generate profits.
-
Compared to its industry, the company has higher Earnings Before Interest, Taxes, Depreciation, and Amortization (EBITDA) of $1.02 Billion, which is 7.85x above the industry average, indicating stronger profitability and robust cash flow generation.
-
The company has higher gross profit of $1.9 Billion, which indicates 3.39x above the industry average, indicating stronger profitability and higher earnings from its core operations.
-
The company's revenue growth of 15.63% exceeds the industry average of -3.1%, indicating strong sales performance and market outperformance.
Debt To Equity Ratio
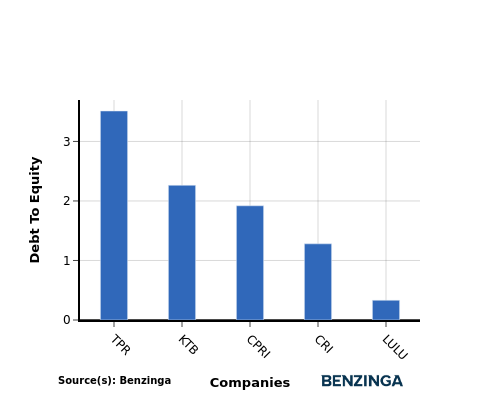
The debt-to-equity (D/E) ratio measures the financial leverage of a company by evaluating its debt relative to its equity.
Considering the debt-to-equity ratio in industry comparisons allows for a concise evaluation of a company's financial health and risk profile, aiding in informed decision-making.
By considering the Debt-to-Equity ratio, Lululemon Athletica can be compared to its top 4 peers, leading to the following observations:
-
Lululemon Athletica is in a relatively stronger financial position compared to its top 4 peers, as evidenced by its lower debt-to-equity ratio of 0.33.
-
This implies that the company relies less on debt financing and has a more favorable balance between debt and equity.
Key Takeaways
For Lululemon Athletica, the PE, PB, and PS ratios are all high compared to its industry peers, indicating that the stock may be overvalued based on these metrics. On the other hand, the high ROE, EBITDA, gross profit, and revenue growth suggest that the company is performing well in terms of profitability and operational efficiency relative to its competitors in the Textiles, Apparel & Luxury Goods industry.
This article was generated by Benzinga's automated content engine and reviewed by an editor.
Posted In: LULU


