Competitor Analysis: Evaluating Cisco Systems And Competitors In Communications Equipment Industry
Author: Benzinga Insights | April 25, 2024 11:00am
In today's rapidly changing and fiercely competitive business landscape, it is essential for investors and industry enthusiasts to thoroughly analyze companies. In this article, we will conduct a comprehensive industry comparison, evaluating Cisco Systems (NASDAQ:CSCO) against its key competitors in the Communications Equipment industry. By examining key financial metrics, market position, and growth prospects, we aim to provide valuable insights for investors and shed light on company's performance within the industry.
Cisco Systems Background
Cisco Systems is the largest provider of networking equipment in the world and one of the largest software companies in the world. Its largest businesses are selling networking hardware and software (where it has leading market shares) and cybersecurity software like firewalls. It also has collaboration products, like its Webex suite, and observability tools. It primarily outsources its manufacturing to third parties and has a large sales and marketing staff—25,000 strong across 90 countries. Overall, Cisco employees 80,000 employees and sells its products globally.
| Company |
P/E |
P/B |
P/S |
ROE |
EBITDA (in billions) |
Gross Profit (in billions) |
Revenue Growth |
| Cisco Systems Inc |
14.70 |
4.23 |
3.45 |
5.76% |
$3.7 |
$8.22 |
-5.89% |
| Motorola Solutions Inc |
34.75 |
79.42 |
5.95 |
109.76% |
$0.88 |
$1.46 |
5.25% |
| Nokia Oyj |
22.84 |
0.90 |
0.91 |
2.08% |
$0.66 |
$2.23 |
-20.34% |
| Juniper Networks Inc |
37.22 |
2.56 |
2.07 |
2.82% |
$0.19 |
$0.81 |
-5.8% |
| F5 Inc |
23.77 |
3.75 |
3.91 |
4.89% |
$0.2 |
$0.56 |
-1.11% |
| Ciena Corp |
29.25 |
2.23 |
1.53 |
1.72% |
$0.13 |
$0.47 |
-1.78% |
| Calix Inc |
100.35 |
2.49 |
1.92 |
0.01% |
$0.0 |
$0.12 |
-9.48% |
| Viavi Solutions Inc |
399.50 |
2.44 |
1.77 |
1.53% |
$0.04 |
$0.15 |
-10.54% |
| Extreme Networks Inc |
18.58 |
13.27 |
1.10 |
3.68% |
$0.02 |
$0.18 |
-6.9% |
| Digi International Inc |
71.47 |
2.06 |
2.55 |
-0.56% |
$0.01 |
$0.06 |
-2.94% |
| Harmonic Inc |
13.10 |
2.42 |
1.82 |
21.56% |
$0.01 |
$0.08 |
1.68% |
| Clearfield Inc |
36.54 |
1.45 |
2.08 |
-1.71% |
$-0.0 |
$0.0 |
-60.17% |
| Aviat Networks Inc |
26.02 |
1.62 |
1.10 |
1.2% |
$0.01 |
$0.04 |
4.8% |
| Average |
67.78 |
9.55 |
2.23 |
12.25% |
$0.18 |
$0.51 |
-8.94% |
Upon closer analysis of Cisco Systems, the following trends become apparent:
-
At 14.7, the stock's Price to Earnings ratio is 0.22x less than the industry average, suggesting favorable growth potential.
-
The current Price to Book ratio of 4.23, which is 0.44x the industry average, is substantially lower than the industry average, indicating potential undervaluation.
-
The Price to Sales ratio of 3.45, which is 1.55x the industry average, suggests the stock could potentially be overvalued in relation to its sales performance compared to its peers.
-
With a Return on Equity (ROE) of 5.76% that is 6.49% below the industry average, it appears that the company exhibits potential inefficiency in utilizing equity to generate profits.
-
The company has higher Earnings Before Interest, Taxes, Depreciation, and Amortization (EBITDA) of $3.7 Billion, which is 20.56x above the industry average, indicating stronger profitability and robust cash flow generation.
-
The gross profit of $8.22 Billion is 16.12x above that of its industry, highlighting stronger profitability and higher earnings from its core operations.
-
The company's revenue growth of -5.89% exceeds the industry average of -8.94%, indicating strong sales performance and market outperformance.
Debt To Equity Ratio
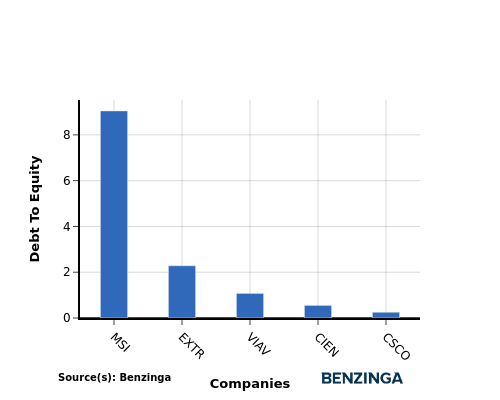
The debt-to-equity (D/E) ratio assesses the extent to which a company relies on borrowed funds compared to its equity.
Considering the debt-to-equity ratio in industry comparisons allows for a concise evaluation of a company's financial health and risk profile, aiding in informed decision-making.
By considering the Debt-to-Equity ratio, Cisco Systems can be compared to its top 4 peers, leading to the following observations:
-
Cisco Systems exhibits a stronger financial position compared to its top 4 peers in the sector, as indicated by its lower debt-to-equity ratio of 0.25.
-
This suggests that the company has a more favorable balance between debt and equity, which can be seen as a positive aspect for investors.
Key Takeaways
The PE, PB, and PS ratios for Cisco Systems indicate that the company is undervalued compared to its peers in the Communications Equipment industry. However, the low ROE suggests that the company may not be utilizing its assets efficiently. On the other hand, the high EBITDA, gross profit, and revenue growth show strong financial performance and potential for future growth when compared to industry peers. Cisco Systems may need to focus on improving its return on equity to align with its strong operational performance.
This article was generated by Benzinga's automated content engine and reviewed by an editor.
Posted In: CSCO


