Exploring The Competitive Space: Vertiv Hldgs Versus Industry Peers In Electrical Equipment
Author: Benzinga Insights | April 25, 2024 11:00am
In the dynamic and cutthroat world of business, conducting thorough company analysis is essential for investors and industry experts. In this article, we will undertake a comprehensive industry comparison, evaluating Vertiv Hldgs (NYSE:VRT) and its primary competitors in the Electrical Equipment industry. By closely examining key financial metrics, market position, and growth prospects, our aim is to provide valuable insights for investors and shed light on company's performance within the industry.
Vertiv Hldgs Background
Vertiv Holdings Co brings together hardware, software, analytics and ongoing services to ensure its customers vital applications run continuously, perform optimally and grow with their business needs. The company solves the important challenges faced by data centers, communication networks and commercial and industrial facilities with a portfolio of power, cooling and IT infrastructure solutions and services that extends from the cloud to the edge of the network. Its services include critical power, thermal management, racks and enclosures, monitoring and management, and other services. Its three business segments include the Americas, Asia Pacific; and Europe, Middle East & Africa.
| Company |
P/E |
P/B |
P/S |
ROE |
EBITDA (in billions) |
Gross Profit (in billions) |
Revenue Growth |
| Vertiv Holdings Co |
71.07 |
15.70 |
4.76 |
12.48% |
$0.3 |
$0.68 |
12.74% |
| Eaton Corp PLC |
39.75 |
6.70 |
5.51 |
5.05% |
$1.35 |
$2.23 |
10.83% |
| Emerson Electric Co |
32.15 |
3.03 |
3.95 |
0.69% |
$0.65 |
$1.92 |
22.06% |
| AMETEK Inc |
31.43 |
4.72 |
6.25 |
4.02% |
$0.53 |
$0.62 |
6.47% |
| Rockwell Automation Inc |
26.24 |
8.75 |
3.49 |
5.98% |
$0.37 |
$0.79 |
3.59% |
| Hubbell Inc |
28.37 |
7.44 |
4.01 |
6.08% |
$0.26 |
$0.46 |
10.35% |
| nVent Electric PLC |
21.88 |
3.89 |
3.80 |
8.38% |
$0.19 |
$0.35 |
16.13% |
| Generac Holdings Inc |
41.95 |
3.53 |
2.12 |
4.08% |
$0.19 |
$0.39 |
1.38% |
| Acuity Brands Inc |
21.18 |
3.63 |
2.08 |
4.23% |
$0.15 |
$0.41 |
-4.0% |
| Atkore Inc |
10.74 |
4.38 |
1.99 |
9.18% |
$0.21 |
$0.29 |
-4.24% |
| EnerSys |
13.67 |
2.12 |
1.02 |
4.5% |
$0.11 |
$0.25 |
-6.38% |
| Array Technologies Inc |
21.84 |
7.16 |
1.18 |
3.63% |
$0.05 |
$0.08 |
-15.04% |
| Powell Industries Inc |
23.39 |
4.88 |
2.36 |
6.77% |
$0.03 |
$0.05 |
52.94% |
| Shoals Technologies Group Inc |
35.38 |
2.65 |
2.86 |
3.1% |
$0.03 |
$0.06 |
37.81% |
| Vicor Corp |
26.92 |
2.63 |
3.56 |
1.62% |
$0.01 |
$0.05 |
-12.17% |
| Thermon Group Holdings Inc |
21.56 |
2.24 |
2.17 |
3.48% |
$0.03 |
$0.06 |
11.72% |
| Preformed Line Products Co |
9.83 |
1.48 |
0.93 |
1.55% |
$0.01 |
$0.05 |
-14.31% |
| Average |
25.39 |
4.33 |
2.96 |
4.52% |
$0.26 |
$0.5 |
7.32% |
Through a meticulous analysis of Vertiv Hldgs, we can observe the following trends:
-
Notably, the current Price to Earnings ratio for this stock, 71.07, is 2.8x above the industry norm, reflecting a higher valuation relative to the industry.
-
With a Price to Book ratio of 15.7, which is 3.63x the industry average, Vertiv Hldgs might be considered overvalued in terms of its book value, as it is trading at a higher multiple compared to its industry peers.
-
With a relatively high Price to Sales ratio of 4.76, which is 1.61x the industry average, the stock might be considered overvalued based on sales performance.
-
With a Return on Equity (ROE) of 12.48% that is 7.96% above the industry average, it appears that the company exhibits efficient use of equity to generate profits.
-
With higher Earnings Before Interest, Taxes, Depreciation, and Amortization (EBITDA) of $300 Million, which is 1.15x above the industry average, the company demonstrates stronger profitability and robust cash flow generation.
-
The gross profit of $680 Million is 1.36x above that of its industry, highlighting stronger profitability and higher earnings from its core operations.
-
The company's revenue growth of 12.74% exceeds the industry average of 7.32%, indicating strong sales performance and market outperformance.
Debt To Equity Ratio
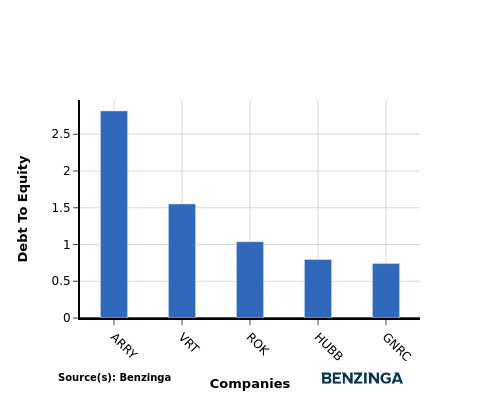
The debt-to-equity (D/E) ratio measures the financial leverage of a company by evaluating its debt relative to its equity.
Considering the debt-to-equity ratio in industry comparisons allows for a concise evaluation of a company's financial health and risk profile, aiding in informed decision-making.
When assessing Vertiv Hldgs against its top 4 peers using the Debt-to-Equity ratio, the following comparisons can be made:
-
Vertiv Hldgs falls in the middle of the list when considering the debt-to-equity ratio.
-
This indicates that the company has a moderate level of debt relative to its equity with a debt-to-equity ratio of 1.55, suggesting a balanced financial structure with a reasonable debt-equitymix.
Key Takeaways
For Vertiv Hldgs in the Electrical Equipment industry, the PE, PB, and PS ratios are all high compared to its peers, indicating potentially overvalued stock. On the other hand, the high ROE, EBITDA, gross profit, and revenue growth suggest strong financial performance and growth potential relative to industry competitors.
This article was generated by Benzinga's automated content engine and reviewed by an editor.
Posted In: VRT


