Comparing Costco Wholesale With Industry Competitors In Consumer Staples Distribution & Retail Industry
Author: Benzinga Insights | April 24, 2024 11:00am
In the dynamic and fiercely competitive business environment, conducting a thorough analysis of companies is crucial for investors and industry enthusiasts. In this article, we will perform an extensive industry comparison, evaluating Costco Wholesale (NASDAQ:COST) in relation to its major competitors in the Consumer Staples Distribution & Retail industry. By closely examining crucial financial metrics, market position, and growth prospects, we aim to offer valuable insights for investors and shed light on company's performance within the industry.
Costco Wholesale Background
Costco operates a membership-based, no-frills retail model, predicated on offering a select product assortment in bulk quantities at bargain prices. The firm avoids maintaining costly product displays by keeping inventory on pallets and limits distribution expenses by storing its inventory at point of sale in the warehouse. Given Costco's frugal cost structure, the firm is able to price its merchandise below competing retailers, driving high sales volume per warehouse and allowing the retailer to generate strong profits on thin margins. Costco operates over 600 warehouses in the United States and boasts over 60% market share in the domestic warehouse club industry. Internationally, Costco operates another 270 warehouses, primarily in markets such as Canada, Mexico, Japan, and the UK.
| Company |
P/E |
P/B |
P/S |
ROE |
EBITDA (in billions) |
Gross Profit (in billions) |
Revenue Growth |
| Costco Wholesale Corp |
47.30 |
15.44 |
1.29 |
7.43% |
$2.79 |
$7.3 |
5.75% |
| Walmart Inc |
30.94 |
5.68 |
0.74 |
6.73% |
$11.33 |
$41.56 |
5.69% |
| Target Corp |
18.63 |
5.72 |
0.72 |
10.65% |
$2.62 |
$8.52 |
1.67% |
| Dollar General Corp |
18.90 |
4.65 |
0.81 |
6.09% |
$0.8 |
$2.91 |
-3.38% |
| BJ's Wholesale Club Holdings Inc |
19.31 |
6.83 |
0.51 |
10.37% |
$0.27 |
$0.96 |
8.68% |
| Sendas Distribuidora SA |
26.43 |
4.04 |
0.28 |
6.63% |
$1.42 |
$3.07 |
8.35% |
| Pricesmart Inc |
20.52 |
2.28 |
0.53 |
3.6% |
$0.08 |
$0.22 |
13.11% |
| Almacenes Exito SA |
24.14 |
0.50 |
0.14 |
1.88% |
$426.56 |
$1373.83 |
-12.61% |
| Average |
22.7 |
4.24 |
0.53 |
6.56% |
$63.3 |
$204.44 |
3.07% |
After examining Costco Wholesale, the following trends can be inferred:
-
The current Price to Earnings ratio of 47.3 is 2.08x higher than the industry average, indicating the stock is priced at a premium level according to the market sentiment.
-
It could be trading at a premium in relation to its book value, as indicated by its Price to Book ratio of 15.44 which exceeds the industry average by 3.64x.
-
With a relatively high Price to Sales ratio of 1.29, which is 2.43x the industry average, the stock might be considered overvalued based on sales performance.
-
The Return on Equity (ROE) of 7.43% is 0.87% above the industry average, highlighting efficient use of equity to generate profits.
-
The company has lower Earnings Before Interest, Taxes, Depreciation, and Amortization (EBITDA) of $2.79 Billion, which is 0.04x below the industry average. This potentially indicates lower profitability or financial challenges.
-
The gross profit of $7.3 Billion is 0.04x below that of its industry, suggesting potential lower revenue after accounting for production costs.
-
The company's revenue growth of 5.75% exceeds the industry average of 3.07%, indicating strong sales performance and market outperformance.
Debt To Equity Ratio
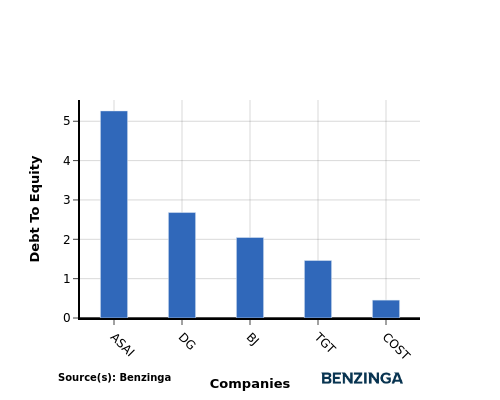
The debt-to-equity (D/E) ratio measures the financial leverage of a company by evaluating its debt relative to its equity.
Considering the debt-to-equity ratio in industry comparisons allows for a concise evaluation of a company's financial health and risk profile, aiding in informed decision-making.
In terms of the Debt-to-Equity ratio, Costco Wholesale stands in comparison with its top 4 peers, leading to the following comparisons:
-
When comparing the debt-to-equity ratio, Costco Wholesale is in a stronger financial position compared to its top 4 peers.
-
The company has a lower level of debt relative to its equity, indicating a more favorable balance between the two with a lower debt-to-equity ratio of 0.45.
Key Takeaways
For Costco Wholesale, the PE, PB, and PS ratios are all high compared to industry peers, indicating a potentially overvalued stock. On the other hand, the high ROE and revenue growth suggest strong profitability and expansion opportunities. However, the low EBITDA and gross profit may raise concerns about operational efficiency and cost management. Overall, Costco Wholesale appears to be well-positioned in terms of growth potential but may need to focus on improving profitability metrics.
This article was generated by Benzinga's automated content engine and reviewed by an editor.
Posted In: COST


