Understanding Merck & Co's Position In Pharmaceuticals Industry Compared To Competitors
Author: Benzinga Insights | April 23, 2024 11:00am
In today's rapidly evolving and fiercely competitive business landscape, it is crucial for investors and industry analysts to conduct comprehensive company evaluations. In this article, we will undertake an in-depth industry comparison, assessing Merck & Co (NYSE:MRK) alongside its primary competitors in the Pharmaceuticals industry. By meticulously examining crucial financial indicators, market positioning, and growth potential, we aim to provide valuable insights to investors and shed light on company's performance within the industry.
Merck & Co Background
Merck makes pharmaceutical products to treat several conditions in a number of therapeutic areas, including cardiometabolic disease, cancer, and infections. Within cancer, the firm's immuno-oncology platform is growing as a major contributor to overall sales. The company also has a substantial vaccine business, with treatments to prevent pediatric diseases as well as human papillomavirus, or HPV. Additionally, Merck sells animal health-related drugs. From a geographical perspective, just under half of the company's sales are generated in the United States.
| Company |
P/E |
P/B |
P/S |
ROE |
EBITDA (in billions) |
Gross Profit (in billions) |
Revenue Growth |
| Merck & Co Inc |
906.71 |
8.56 |
5.38 |
-3.11% |
$-0.77 |
$10.72 |
5.78% |
| Eli Lilly and Co |
126.09 |
64.55 |
19.36 |
19.91% |
$3.03 |
$7.57 |
28.1% |
| Novo Nordisk A/S |
47.09 |
36.71 |
16.97 |
22.01% |
$28.51 |
$55.85 |
36.95% |
| AstraZeneca PLC |
36.81 |
5.55 |
4.78 |
2.52% |
$2.18 |
$9.72 |
7.29% |
| Novartis AG |
23.20 |
4.17 |
4.26 |
19.99% |
$4.18 |
$8.75 |
7.39% |
| Pfizer Inc |
70.97 |
1.67 |
2.53 |
-3.62% |
$-1.77 |
$6.69 |
-41.34% |
| Sanofi SA |
20.56 |
1.49 |
2.39 |
-0.75% |
$0.42 |
$8.15 |
6.5% |
| Bristol-Myers Squibb Co |
12.73 |
3.38 |
2.27 |
6.03% |
$4.45 |
$8.73 |
0.62% |
| GSK PLC |
13.69 |
5.02 |
2.22 |
2.64% |
$1.16 |
$5.63 |
9.16% |
| Zoetis Inc |
28.71 |
13.31 |
7.87 |
10.42% |
$0.83 |
$1.49 |
8.48% |
| Takeda Pharmaceutical Co Ltd |
36.74 |
0.96 |
1.57 |
1.53% |
$314.89 |
$731.71 |
1.33% |
| Viatris Inc |
225 |
0.65 |
0.88 |
-3.7% |
$-0.07 |
$1.6 |
-1.0% |
| Dr Reddy's Laboratories Ltd |
19.24 |
3.75 |
3.70 |
5.29% |
$22.42 |
$42.2 |
6.57% |
| Jazz Pharmaceuticals PLC |
17.83 |
1.81 |
2.04 |
2.61% |
$0.29 |
$0.9 |
4.1% |
| Average |
52.2 |
11.0 |
5.45 |
6.53% |
$29.27 |
$68.38 |
5.7% |
By analyzing Merck & Co, we can infer the following trends:
-
The current Price to Earnings ratio of 906.71 is 17.37x higher than the industry average, indicating the stock is priced at a premium level according to the market sentiment.
-
Considering a Price to Book ratio of 8.56, which is well below the industry average by 0.78x, the stock may be undervalued based on its book value compared to its peers.
-
Based on its sales performance, the stock could be deemed undervalued with a Price to Sales ratio of 5.38, which is 0.99x the industry average.
-
The company has a lower Return on Equity (ROE) of -3.11%, which is 9.64% below the industry average. This indicates potential inefficiency in utilizing equity to generate profits, which could be attributed to various factors.
-
Compared to its industry, the company has lower Earnings Before Interest, Taxes, Depreciation, and Amortization (EBITDA) of $-770 Million, which is -0.03x below the industry average, potentially indicating lower profitability or financial challenges.
-
The gross profit of $10.72 Billion is 0.16x below that of its industry, suggesting potential lower revenue after accounting for production costs.
-
The company is experiencing remarkable revenue growth, with a rate of 5.78%, outperforming the industry average of 5.7%.
Debt To Equity Ratio
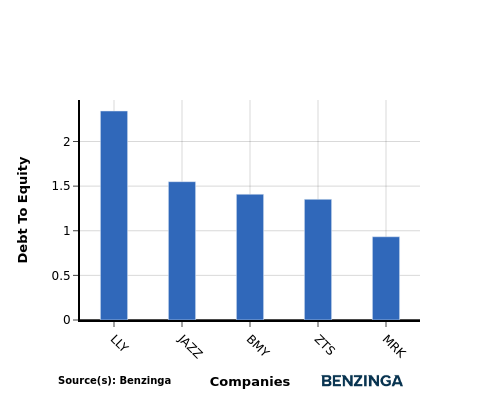
The debt-to-equity (D/E) ratio measures the financial leverage of a company by evaluating its debt relative to its equity.
Considering the debt-to-equity ratio in industry comparisons allows for a concise evaluation of a company's financial health and risk profile, aiding in informed decision-making.
In terms of the Debt-to-Equity ratio, Merck & Co can be assessed by comparing it to its top 4 peers, resulting in the following observations:
-
Among its top 4 peers, Merck & Co has a stronger financial position with a lower debt-to-equity ratio of 0.93.
-
This indicates that the company relies less on debt financing and maintains a more favorable balance between debt and equity, which can be viewed positively by investors.
Key Takeaways
For Merck & Co in the Pharmaceuticals industry, the PE ratio is high compared to peers, indicating potential overvaluation. The PB and PS ratios are low, suggesting undervaluation relative to industry standards. In terms of ROE, EBITDA, gross profit, and revenue growth, Merck & Co lags behind its competitors, signaling weaker financial performance and growth prospects within the sector.
This article was generated by Benzinga's automated content engine and reviewed by an editor.
Posted In: MRK


