In-Depth Analysis: Apple Versus Competitors In Technology Hardware, Storage & Peripherals Industry
Author: Benzinga Insights | April 23, 2024 11:00am
In the fast-paced and cutthroat world of business, conducting thorough company analysis is essential for investors and industry experts. In this article, we will undertake a comprehensive industry comparison, evaluating Apple (NASDAQ:AAPL) in comparison to its major competitors within the Technology Hardware, Storage & Peripherals industry. By analyzing crucial financial metrics, market position, and growth potential, our objective is to provide valuable insights for investors and offer a deeper understanding of company's performance in the industry.
Apple Background
Apple is among the largest companies in the world, with a broad portfolio of hardware and software products targeted at consumers and businesses. Apple's iPhone makes up a majority of the firm sales, and Apple's other products like Mac, iPad, and Watch are designed around the iPhone as the focal point of an expansive software ecosystem. Apple has progressively worked to add new applications, like streaming video, subscription bundles, and augmented reality. The firm designs its own software and semiconductors while working with subcontractors like Foxconn and TSMC to build its products and chips. Slightly less than half of Apple's sales come directly through its flagship stores, with a majority of sales coming indirectly through partnerships and distribution.
| Company |
P/E |
P/B |
P/S |
ROE |
EBITDA (in billions) |
Gross Profit (in billions) |
Revenue Growth |
| Apple Inc |
25.80 |
34.57 |
6.76 |
49.79% |
$43.22 |
$54.85 |
2.07% |
| Super Micro Computer Inc |
56.10 |
13.64 |
4.42 |
11.29% |
$0.37 |
$0.56 |
103.25% |
| Hewlett Packard Enterprise Co |
11.61 |
1.02 |
0.79 |
1.82% |
$1.23 |
$2.46 |
-13.5% |
| NetApp Inc |
22.30 |
20.33 |
3.39 |
35.49% |
$0.46 |
$1.15 |
5.24% |
| Pure Storage Inc |
265.84 |
12.92 |
5.93 |
5.41% |
$0.11 |
$0.57 |
-2.52% |
| Corsair Gaming Inc |
365 |
1.69 |
0.80 |
0.94% |
$0.03 |
$0.1 |
4.65% |
| Eastman Kodak Co |
6.96 |
0.40 |
0.38 |
0.21% |
$0.03 |
$0.05 |
-9.84% |
| AstroNova Inc |
28.20 |
1.52 |
0.90 |
3.06% |
$0.01 |
$0.01 |
-0.65% |
| Transact Technologies Inc |
10.23 |
1.22 |
0.66 |
-0.16% |
$0.0 |
$0.01 |
-26.13% |
| Average |
95.78 |
6.59 |
2.16 |
7.26% |
$0.28 |
$0.61 |
7.56% |
By closely examining Apple, we can identify the following trends:
-
At 25.8, the stock's Price to Earnings ratio is 0.27x less than the industry average, suggesting favorable growth potential.
-
It could be trading at a premium in relation to its book value, as indicated by its Price to Book ratio of 34.57 which exceeds the industry average by 5.25x.
-
The Price to Sales ratio of 6.76, which is 3.13x the industry average, suggests the stock could potentially be overvalued in relation to its sales performance compared to its peers.
-
With a Return on Equity (ROE) of 49.79% that is 42.53% above the industry average, it appears that the company exhibits efficient use of equity to generate profits.
-
Compared to its industry, the company has higher Earnings Before Interest, Taxes, Depreciation, and Amortization (EBITDA) of $43.22 Billion, which is 154.36x above the industry average, indicating stronger profitability and robust cash flow generation.
-
With higher gross profit of $54.85 Billion, which indicates 89.92x above the industry average, the company demonstrates stronger profitability and higher earnings from its core operations.
-
With a revenue growth of 2.07%, which is much lower than the industry average of 7.56%, the company is experiencing a notable slowdown in sales expansion.
Debt To Equity Ratio
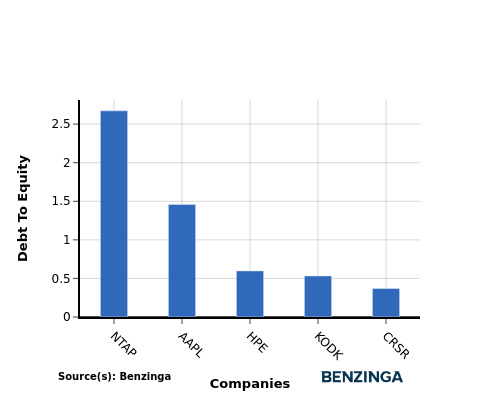
The debt-to-equity (D/E) ratio indicates the proportion of debt and equity used by a company to finance its assets and operations.
Considering the debt-to-equity ratio in industry comparisons allows for a concise evaluation of a company's financial health and risk profile, aiding in informed decision-making.
By analyzing Apple in relation to its top 4 peers based on the Debt-to-Equity ratio, the following insights can be derived:
-
Apple holds a middle position in terms of the debt-to-equity ratio compared to its top 4 peers.
-
This indicates a balanced financial structure with a moderate level of debt and an appropriate reliance on equity financing with a debt-to-equity ratio of 1.46.
Key Takeaways
For Apple in the Technology Hardware, Storage & Peripherals industry, the PE ratio is low compared to peers, indicating potential undervaluation. The high PB and PS ratios suggest strong market sentiment and revenue multiples. Apple's high ROE, EBITDA, and gross profit reflect efficient operations and profitability. However, the low revenue growth may indicate challenges in expanding market share compared to industry peers.
This article was generated by Benzinga's automated content engine and reviewed by an editor.
Posted In: AAPL


