Comparative Study: Taiwan Semiconductor And Industry Competitors In Semiconductors & Semiconductor Equipment Industry
Author: Benzinga Insights | April 22, 2024 11:00am
In today's rapidly evolving and fiercely competitive business landscape, it is crucial for investors and industry analysts to conduct comprehensive company evaluations. In this article, we will undertake an in-depth industry comparison, assessing Taiwan Semiconductor (NYSE:TSM) alongside its primary competitors in the Semiconductors & Semiconductor Equipment industry. By meticulously examining crucial financial indicators, market positioning, and growth potential, we aim to provide valuable insights to investors and shed light on company's performance within the industry.
Taiwan Semiconductor Background
Taiwan Semiconductor Manufacturing Co. is the world's largest dedicated chip foundry, with almost 60% market share. TSMC was founded in 1987 as a joint venture of Philips, the government of Taiwan, and private investors. It went public as an ADR in the U.S. in 1997. TSMC's scale and high-quality technology allow the firm to generate solid operating margins, even in the highly competitive foundry business. Furthermore, the shift to the fabless business model has created tailwinds for TSMC. The foundry leader has an illustrious customer base, including Apple, AMD, and Nvidia, that looks to apply cutting-edge process technologies to its semiconductor designs. TSMC employs more than 73,000 people.
| Company |
P/E |
P/B |
P/S |
ROE |
EBITDA (in billions) |
Gross Profit (in billions) |
Revenue Growth |
| Taiwan Semiconductor Manufacturing Co Ltd |
24.63 |
6.25 |
9.55 |
7.43% |
$431.99 |
$331.77 |
-0.0% |
| NVIDIA Corp |
63.87 |
44.33 |
31.19 |
32.23% |
$14.56 |
$16.79 |
265.28% |
| Broadcom Inc |
44.74 |
7.94 |
13.52 |
2.81% |
$4.61 |
$7.38 |
34.17% |
| Advanced Micro Devices Inc |
276.68 |
4.24 |
10.51 |
1.2% |
$1.22 |
$2.91 |
10.16% |
| Qualcomm Inc |
22.48 |
7.63 |
4.89 |
12.4% |
$3.58 |
$5.62 |
4.99% |
| Intel Corp |
85.47 |
1.38 |
2.66 |
2.57% |
$5.57 |
$7.05 |
9.71% |
| Texas Instruments Inc |
22.59 |
8.60 |
8.35 |
8.14% |
$1.98 |
$2.43 |
-12.7% |
| Analog Devices Inc |
32.73 |
2.56 |
7.97 |
1.3% |
$1.12 |
$1.47 |
-22.68% |
| ARM Holdings PLC |
1054.20 |
17.91 |
30.50 |
1.78% |
$0.18 |
$0.79 |
13.81% |
| Microchip Technology Inc |
19.08 |
6.23 |
5.26 |
5.97% |
$0.75 |
$1.12 |
-18.6% |
| STMicroelectronics NV |
8.65 |
2.08 |
2.11 |
6.69% |
$1.5 |
$1.95 |
-3.21% |
| Monolithic Power Systems Inc |
67.53 |
14.04 |
15.84 |
4.85% |
$0.12 |
$0.25 |
-1.3% |
| ON Semiconductor Corp |
12.41 |
3.35 |
3.29 |
7.37% |
$0.79 |
$0.94 |
-4.06% |
| GLOBALFOUNDRIES Inc |
25.28 |
2.30 |
3.48 |
2.53% |
$0.73 |
$0.53 |
0.11% |
| ASE Technology Holding Co Ltd |
20.23 |
2.39 |
1.22 |
4.45% |
$29.8 |
$25.76 |
-9.49% |
| First Solar Inc |
22.61 |
2.80 |
5.66 |
5.38% |
$0.47 |
$0.5 |
15.58% |
| United Microelectronics Corp |
9.92 |
1.67 |
2.72 |
3.72% |
$25.78 |
$17.81 |
-3.7% |
| Skyworks Solutions Inc |
17.03 |
2.48 |
3.32 |
3.76% |
$0.37 |
$0.51 |
-9.61% |
| Lattice Semiconductor Corp |
35.96 |
13.22 |
12.61 |
14.98% |
$0.05 |
$0.12 |
-3.05% |
| Universal Display Corp |
35.33 |
4.90 |
12.38 |
4.36% |
$0.08 |
$0.12 |
-6.34% |
| MACOM Technology Solutions Holdings Inc |
89.27 |
6.53 |
10.65 |
1.27% |
$0.03 |
$0.09 |
-12.75% |
| Rambus Inc |
18.17 |
5.72 |
13.15 |
5.87% |
$0.07 |
$0.1 |
-0.12% |
| Average |
94.49 |
7.73 |
9.58 |
6.36% |
$4.45 |
$4.49 |
11.72% |
By conducting an in-depth analysis of Taiwan Semiconductor, we can identify the following trends:
-
The Price to Earnings ratio of 24.63 is 0.26x lower than the industry average, indicating potential undervaluation for the stock.
-
Considering a Price to Book ratio of 6.25, which is well below the industry average by 0.81x, the stock may be undervalued based on its book value compared to its peers.
-
Based on its sales performance, the stock could be deemed undervalued with a Price to Sales ratio of 9.55, which is 1.0x the industry average.
-
The company has a higher Return on Equity (ROE) of 7.43%, which is 1.07% above the industry average. This suggests efficient use of equity to generate profits and demonstrates profitability and growth potential.
-
The Earnings Before Interest, Taxes, Depreciation, and Amortization (EBITDA) of $431.99 Billion is 97.08x above the industry average, highlighting stronger profitability and robust cash flow generation.
-
With higher gross profit of $331.77 Billion, which indicates 73.89x above the industry average, the company demonstrates stronger profitability and higher earnings from its core operations.
-
The company's revenue growth of -0.0% is significantly lower compared to the industry average of 11.72%. This indicates a potential fall in the company's sales performance.
Debt To Equity Ratio
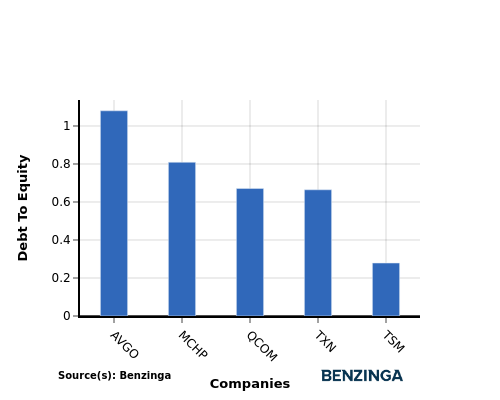
The debt-to-equity (D/E) ratio is a measure that indicates the level of debt a company has taken on relative to the value of its assets net of liabilities.
Considering the debt-to-equity ratio in industry comparisons allows for a concise evaluation of a company's financial health and risk profile, aiding in informed decision-making.
In terms of the Debt-to-Equity ratio, Taiwan Semiconductor stands in comparison with its top 4 peers, leading to the following comparisons:
-
In terms of the debt-to-equity ratio, Taiwan Semiconductor has a lower level of debt compared to its top 4 peers, indicating a stronger financial position.
-
This implies that the company relies less on debt financing and has a more favorable balance between debt and equity with a lower debt-to-equity ratio of 0.28.
Key Takeaways
For Taiwan Semiconductor's PE, PB, and PS ratios being low compared to peers in the Semiconductors & Semiconductor Equipment industry, it suggests the company may be undervalued based on its earnings, book value, and sales. On the other hand, its high ROE, EBITDA, and gross profit indicate strong profitability and operational efficiency. However, the low revenue growth implies a slower expansion rate compared to industry peers.
This article was generated by Benzinga's automated content engine and reviewed by an editor.
Posted In: TSM


