What 5 Analyst Ratings Have To Say About Banner
Author: Benzinga Insights | April 19, 2024 02:01pm
Ratings for Banner (NASDAQ:BANR) were provided by 5 analysts in the past three months, showcasing a mix of bullish and bearish perspectives.
The table below provides a snapshot of their recent ratings, showcasing how sentiments have evolved over the past 30 days and comparing them to the preceding months.
|
Bullish |
Somewhat Bullish |
Indifferent |
Somewhat Bearish |
Bearish |
| Total Ratings |
0 |
3 |
2 |
0 |
0 |
| Last 30D |
0 |
2 |
1 |
0 |
0 |
| 1M Ago |
0 |
0 |
0 |
0 |
0 |
| 2M Ago |
0 |
0 |
0 |
0 |
0 |
| 3M Ago |
0 |
1 |
1 |
0 |
0 |
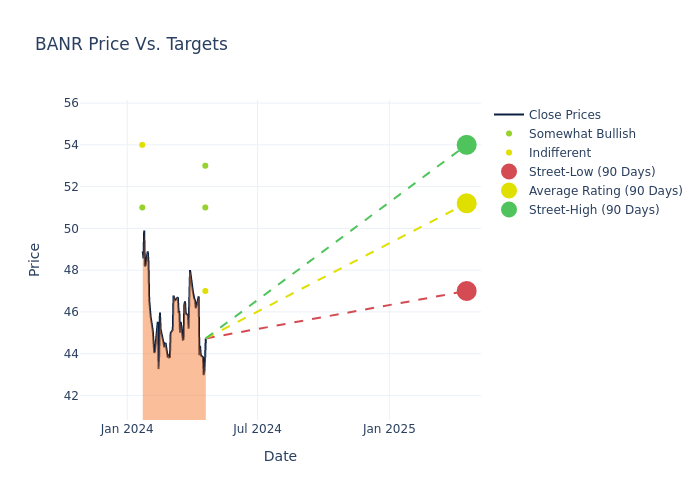
Analysts have recently evaluated Banner and provided 12-month price targets. The average target is $51.2, accompanied by a high estimate of $54.00 and a low estimate of $47.00. A 2.66% drop is evident in the current average compared to the previous average price target of $52.60.
Decoding Analyst Ratings: A Detailed Look
An in-depth analysis of recent analyst actions unveils how financial experts perceive Banner. The following summary outlines key analysts, their recent evaluations, and adjustments to ratings and price targets.
| Analyst |
Analyst Firm |
Action Taken |
Rating |
Current Price Target |
Prior Price Target |
| Andrew Liesch |
Piper Sandler |
Lowers |
Overweight |
$51.00 |
$54.00 |
| Jeffrey Rulis |
DA Davidson |
Lowers |
Neutral |
$47.00 |
$50.00 |
| Andrew Terrell |
Stephens & Co. |
Lowers |
Overweight |
$53.00 |
$54.00 |
| Kelly Motta |
Keefe, Bruyette & Woods |
Lowers |
Market Perform |
$54.00 |
$58.00 |
| David Feaster |
Raymond James |
Raises |
Outperform |
$51.00 |
$47.00 |
Key Insights:
- Action Taken: Analysts frequently update their recommendations based on evolving market conditions and company performance. Whether they 'Maintain', 'Raise' or 'Lower' their stance, it reflects their reaction to recent developments related to Banner. This information provides a snapshot of how analysts perceive the current state of the company.
- Rating: Analysts assign qualitative assessments to stocks, ranging from 'Outperform' to 'Underperform'. These ratings convey the analysts' expectations for the relative performance of Banner compared to the broader market.
- Price Targets: Gaining insights, analysts provide estimates for the future value of Banner's stock. This comparison reveals trends in analysts' expectations over time.
Capture valuable insights into Banner's market standing by understanding these analyst evaluations alongside pertinent financial indicators. Stay informed and make strategic decisions with our Ratings Table.
Stay up to date on Banner analyst ratings.
If you are interested in following small-cap stock news and performance you can start by tracking it here.
About Banner
Banner Corp is a bank holding company. It wholly owns one subsidiary bank, Banner Bank. The Bank's primary business is that of traditional banking institutions, accepting deposits and originating loans in locations surrounding its offices in Washington, Oregon, California, Idaho and Utah. Banner Bank also actively participates in the secondary loan markets, engaging in mortgage banking operations largely through the origination and sale of one to four family residential loans.
Key Indicators: Banner's Financial Health
Market Capitalization Analysis: With an elevated market capitalization, the company stands out above industry averages, showcasing substantial size and market acknowledgment.
Revenue Challenges: Banner's revenue growth over 3 months faced difficulties. As of 31 December, 2023, the company experienced a decline of approximately -12.6%. This indicates a decrease in top-line earnings. In comparison to its industry peers, the company trails behind with a growth rate lower than the average among peers in the Financials sector.
Net Margin: Banner's net margin is impressive, surpassing industry averages. With a net margin of 28.37%, the company demonstrates strong profitability and effective cost management.
Return on Equity (ROE): The company's ROE is a standout performer, exceeding industry averages. With an impressive ROE of 2.69%, the company showcases effective utilization of equity capital.
Return on Assets (ROA): Banner's ROA stands out, surpassing industry averages. With an impressive ROA of 0.27%, the company demonstrates effective utilization of assets and strong financial performance.
Debt Management: Banner's debt-to-equity ratio is below the industry average at 0.32, reflecting a lower dependency on debt financing and a more conservative financial approach.
The Core of Analyst Ratings: What Every Investor Should Know
Within the domain of banking and financial systems, analysts specialize in reporting for specific stocks or defined sectors. Their work involves attending company conference calls and meetings, researching company financial statements, and communicating with insiders to publish "analyst ratings" for stocks. Analysts typically assess and rate each stock once per quarter.
Some analysts publish their predictions for metrics such as growth estimates, earnings, and revenue to provide additional guidance with their ratings. When using analyst ratings, it is important to keep in mind that stock and sector analysts are also human and are only offering their opinions to investors.
If you want to keep track of which analysts are outperforming others, you can view updated analyst ratings along withanalyst success scores in Benzinga Pro.
This article was generated by Benzinga's automated content engine and reviewed by an editor.
Posted In: BANR