Competitor Analysis: Evaluating ON Semiconductor And Competitors In Semiconductors & Semiconductor Equipment Industry
Author: Benzinga Insights | April 19, 2024 11:01am
In today's rapidly changing and highly competitive business world, it is vital for investors and industry enthusiasts to carefully assess companies. In this article, we will perform a comprehensive industry comparison, evaluating ON Semiconductor (NASDAQ:ON) against its key competitors in the Semiconductors & Semiconductor Equipment industry. By analyzing important financial metrics, market position, and growth prospects, we aim to provide valuable insights for investors and shed light on company's performance within the industry.
ON Semiconductor Background
Onsemi is a supplier of power semiconductors and sensors focused on the automotive and industrial markets. Onsemi is the second-largest power chipmaker in the world and the largest supplier of image sensors to the automotive market. While the firm used to be highly vertically integrated, it now pursues a hybrid manufacturing strategy for flexible capacity. Onsemi is pivoting to focus on emerging applications like electric vehicles, autonomous vehicles, industrial automation, and renewable energy.
| Company |
P/E |
P/B |
P/S |
ROE |
EBITDA (in billions) |
Gross Profit (in billions) |
Revenue Growth |
| ON Semiconductor Corp |
12.87 |
3.48 |
3.41 |
7.37% |
$0.79 |
$0.94 |
-4.06% |
| NVIDIA Corp |
70.97 |
49.25 |
34.66 |
32.23% |
$14.56 |
$16.79 |
265.28% |
| Broadcom Inc |
46.79 |
8.30 |
14.14 |
2.81% |
$4.61 |
$7.38 |
34.17% |
| Advanced Micro Devices Inc |
292.63 |
4.48 |
11.11 |
1.2% |
$1.22 |
$2.91 |
10.16% |
| Qualcomm Inc |
23.03 |
7.81 |
5 |
12.4% |
$3.58 |
$5.62 |
4.99% |
| Intel Corp |
87.60 |
1.41 |
2.72 |
2.57% |
$5.57 |
$7.05 |
9.71% |
| Texas Instruments Inc |
23.14 |
8.81 |
8.56 |
8.14% |
$1.98 |
$2.43 |
-12.7% |
| ARM Holdings PLC |
1269 |
21.56 |
36.71 |
1.78% |
$0.18 |
$0.79 |
13.81% |
| Analog Devices Inc |
33.49 |
2.62 |
8.15 |
1.3% |
$1.12 |
$1.47 |
-22.68% |
| Microchip Technology Inc |
19.68 |
6.43 |
5.42 |
5.97% |
$0.75 |
$1.12 |
-18.6% |
| STMicroelectronics NV |
8.88 |
2.13 |
2.16 |
6.69% |
$1.5 |
$1.95 |
-3.21% |
| Monolithic Power Systems Inc |
70.75 |
14.71 |
16.60 |
4.85% |
$0.12 |
$0.25 |
-1.3% |
| GLOBALFOUNDRIES Inc |
25.63 |
2.34 |
3.53 |
2.53% |
$0.73 |
$0.53 |
0.11% |
| ASE Technology Holding Co Ltd |
20.94 |
2.47 |
1.26 |
4.45% |
$29.8 |
$25.76 |
-9.49% |
| United Microelectronics Corp |
10.14 |
1.71 |
2.78 |
3.72% |
$25.78 |
$17.81 |
-3.7% |
| First Solar Inc |
22.52 |
2.79 |
5.64 |
5.38% |
$0.47 |
$0.5 |
15.58% |
| Skyworks Solutions Inc |
17.31 |
2.51 |
3.37 |
3.76% |
$0.37 |
$0.51 |
-9.61% |
| Lattice Semiconductor Corp |
37.14 |
13.65 |
13.03 |
14.98% |
$0.05 |
$0.12 |
-3.05% |
| Universal Display Corp |
36.09 |
5.01 |
12.64 |
4.36% |
$0.08 |
$0.12 |
-6.34% |
| MACOM Technology Solutions Holdings Inc |
91.51 |
6.70 |
10.91 |
1.27% |
$0.03 |
$0.09 |
-12.75% |
| Rambus Inc |
18.77 |
5.91 |
13.59 |
5.87% |
$0.07 |
$0.1 |
-0.12% |
| Average |
111.3 |
8.53 |
10.6 |
6.31% |
$4.63 |
$4.67 |
12.51% |
Upon analyzing ON Semiconductor, the following trends can be observed:
-
The stock's Price to Earnings ratio of 12.87 is lower than the industry average by 0.12x, suggesting potential value in the eyes of market participants.
-
The current Price to Book ratio of 3.48, which is 0.41x the industry average, is substantially lower than the industry average, indicating potential undervaluation.
-
With a relatively low Price to Sales ratio of 3.41, which is 0.32x the industry average, the stock might be considered undervalued based on sales performance.
-
With a Return on Equity (ROE) of 7.37% that is 1.06% above the industry average, it appears that the company exhibits efficient use of equity to generate profits.
-
With lower Earnings Before Interest, Taxes, Depreciation, and Amortization (EBITDA) of $790 Million, which is 0.17x below the industry average, the company may face lower profitability or financial challenges.
-
With lower gross profit of $940 Million, which indicates 0.2x below the industry average, the company may experience lower revenue after accounting for production costs.
-
The company's revenue growth of -4.06% is significantly below the industry average of 12.51%. This suggests a potential struggle in generating increased sales volume.
Debt To Equity Ratio
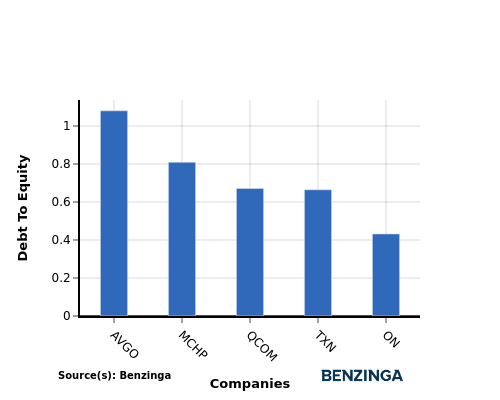
The debt-to-equity (D/E) ratio is a measure that indicates the level of debt a company has taken on relative to the value of its assets net of liabilities.
Considering the debt-to-equity ratio in industry comparisons allows for a concise evaluation of a company's financial health and risk profile, aiding in informed decision-making.
In light of the Debt-to-Equity ratio, a comparison between ON Semiconductor and its top 4 peers reveals the following information:
-
Among its top 4 peers, ON Semiconductor has a stronger financial position with a lower debt-to-equity ratio of 0.43.
-
This indicates that the company relies less on debt financing and maintains a more favorable balance between debt and equity, which can be viewed positively by investors.
Key Takeaways
For ON Semiconductor, the PE, PB, and PS ratios are all low compared to industry peers, indicating potential undervaluation. The high ROE suggests efficient use of shareholder funds, while low EBITDA and gross profit may indicate room for improvement in operational efficiency. Additionally, the low revenue growth implies a slower expansion rate compared to industry competitors.
This article was generated by Benzinga's automated content engine and reviewed by an editor.
Posted In: ON


