Insights Into Coinbase Glb's Performance Versus Peers In Capital Markets Sector
Author: Benzinga Insights | April 19, 2024 11:00am
In today's fast-paced and highly competitive business world, it is crucial for investors and industry followers to conduct comprehensive company evaluations. In this article, we will delve into an extensive industry comparison, evaluating Coinbase Glb (NASDAQ:COIN) in relation to its major competitors in the Capital Markets industry. By closely examining key financial metrics, market standing, and growth prospects, our objective is to provide valuable insights and highlight company's performance in the industry.
Coinbase Glb Background
Founded in 2012, Coinbase is the leading cryptocurrency exchange platform in the United States. The company intends to be the safe and regulation-compliant point of entry for retail investors and institutions into the cryptocurrency economy. Users can establish an account directly with the firm, instead of using an intermediary, and many choose to allow Coinbase to act as a custodian for their cryptocurrency, giving the company breadth beyond that of a traditional financial exchange. While the company still generates the majority of its revenue from transaction fees charged to its retail customers, Coinbase uses internal investment and acquisitions to expand into adjacent businesses, such as prime brokerage and data analytics.
| Company |
P/E |
P/B |
P/S |
ROE |
EBITDA (in billions) |
Gross Profit (in billions) |
Revenue Growth |
| Coinbase Global Inc |
589.32 |
8.41 |
17.85 |
4.48% |
$0.18 |
$0.83 |
51.61% |
| S&P Global Inc |
50.23 |
3.87 |
10.55 |
1.66% |
$1.16 |
$2.12 |
7.32% |
| CME Group Inc |
23.66 |
2.82 |
13.51 |
2.93% |
$1.13 |
$1.23 |
19.17% |
| Intercontinental Exchange Inc |
31.26 |
2.92 |
7.47 |
1.46% |
$1.15 |
$1.5 |
12.16% |
| Nasdaq Inc |
28.88 |
3.20 |
5.04 |
2.28% |
$0.51 |
$0.74 |
4.11% |
| Tradeweb Markets Inc |
59.06 |
4 |
16.05 |
1.68% |
$0.18 |
$0.24 |
26.26% |
| FactSet Research Systems Inc |
33.98 |
9.09 |
7.73 |
8.05% |
$0.22 |
$0.29 |
5.99% |
| Morningstar Inc |
88.82 |
9.41 |
6.15 |
5.72% |
$0.15 |
$0.33 |
13.41% |
| MarketAxess Holdings Inc |
29.66 |
5.95 |
10.16 |
5.61% |
$0.11 |
$0.14 |
10.87% |
| Donnelley Financial Solutions Inc |
22.94 |
4.52 |
2.37 |
2.69% |
$0.03 |
$0.1 |
5.25% |
| Open Lending Corp |
25.72 |
2.68 |
4.79 |
-2.3% |
$-0.0 |
$0.01 |
-44.3% |
| Value Line Inc |
19.08 |
3.91 |
9.14 |
6.73% |
$0.0 |
$0.01 |
-8.39% |
| Average |
37.57 |
4.76 |
8.45 |
3.32% |
$0.42 |
$0.61 |
4.71% |
Upon a comprehensive analysis of Coinbase Glb, the following trends can be discerned:
-
The current Price to Earnings ratio of 589.32 is 15.69x higher than the industry average, indicating the stock is priced at a premium level according to the market sentiment.
-
The elevated Price to Book ratio of 8.41 relative to the industry average by 1.77x suggests company might be overvalued based on its book value.
-
The stock's relatively high Price to Sales ratio of 17.85, surpassing the industry average by 2.11x, may indicate an aspect of overvaluation in terms of sales performance.
-
The company has a higher Return on Equity (ROE) of 4.48%, which is 1.16% above the industry average. This suggests efficient use of equity to generate profits and demonstrates profitability and growth potential.
-
With lower Earnings Before Interest, Taxes, Depreciation, and Amortization (EBITDA) of $180 Million, which is 0.43x below the industry average, the company may face lower profitability or financial challenges.
-
Compared to its industry, the company has higher gross profit of $830 Million, which indicates 1.36x above the industry average, indicating stronger profitability and higher earnings from its core operations.
-
With a revenue growth of 51.61%, which surpasses the industry average of 4.71%, the company is demonstrating robust sales expansion and gaining market share.
Debt To Equity Ratio
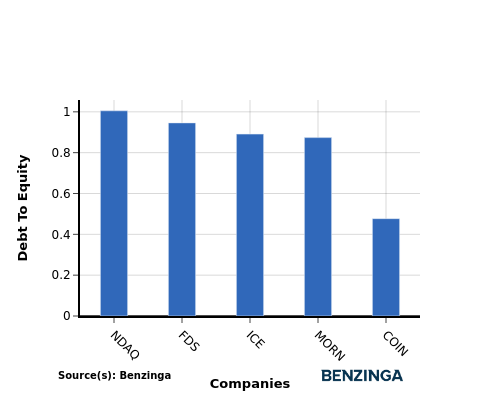
The debt-to-equity (D/E) ratio is a financial metric that helps determine the level of financial risk associated with a company's capital structure.
Considering the debt-to-equity ratio in industry comparisons allows for a concise evaluation of a company's financial health and risk profile, aiding in informed decision-making.
In light of the Debt-to-Equity ratio, a comparison between Coinbase Glb and its top 4 peers reveals the following information:
-
When considering the debt-to-equity ratio, Coinbase Glb exhibits a stronger financial position compared to its top 4 peers.
-
This indicates that the company has a favorable balance between debt and equity, with a lower debt-to-equity ratio of 0.48, which can be perceived as a positive aspect by investors.
Key Takeaways
For Coinbase Glb, the PE, PB, and PS ratios are all high compared to industry peers, indicating potentially overvalued stock. On the other hand, the high ROE, gross profit, and revenue growth suggest strong financial performance and growth potential, despite the low EBITDA. In the Capital Markets industry, Coinbase Glb stands out for its robust profitability and revenue growth, although its stock valuation may be a concern.
This article was generated by Benzinga's automated content engine and reviewed by an editor.
Posted In: COIN


