Critical Insights From Red Rock Resorts Analyst Ratings: What You Need To Know
Author: Benzinga Insights | April 19, 2024 08:00am
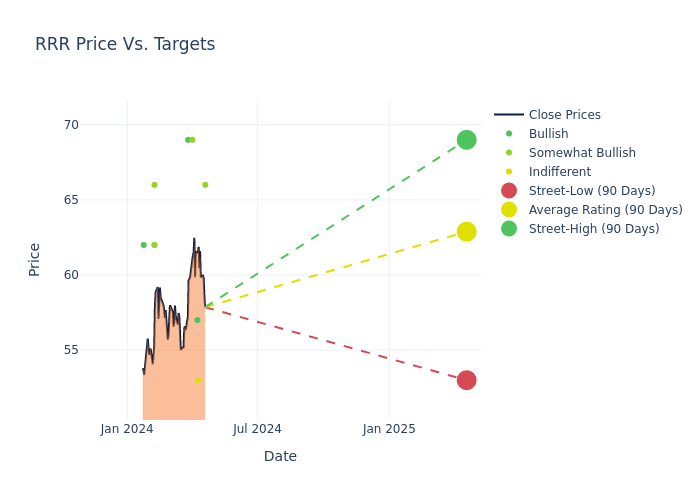
In the last three months, 12 analysts have published ratings on Red Rock Resorts (NASDAQ:RRR), offering a diverse range of perspectives from bullish to bearish.
The table below provides a concise overview of recent ratings by analysts, offering insights into the changing sentiments over the past 30 days and drawing comparisons with the preceding months for a holistic perspective.
|
Bullish |
Somewhat Bullish |
Indifferent |
Somewhat Bearish |
Bearish |
| Total Ratings |
3 |
7 |
2 |
0 |
0 |
| Last 30D |
0 |
1 |
0 |
0 |
0 |
| 1M Ago |
2 |
1 |
1 |
0 |
0 |
| 2M Ago |
0 |
0 |
0 |
0 |
0 |
| 3M Ago |
1 |
5 |
1 |
0 |
0 |
Insights from analysts' 12-month price targets are revealed, presenting an average target of $61.75, a high estimate of $69.00, and a low estimate of $51.00. This upward trend is apparent, with the current average reflecting a 12.09% increase from the previous average price target of $55.09.
Analyzing Analyst Ratings: A Detailed Breakdown
The standing of Red Rock Resorts among financial experts becomes clear with a thorough analysis of recent analyst actions. The summary below outlines key analysts, their recent evaluations, and adjustments to ratings and price targets.
| Analyst |
Analyst Firm |
Action Taken |
Rating |
Current Price Target |
Prior Price Target |
| Jordan Bender |
JMP Securities |
Raises |
Market Outperform |
$66.00 |
$61.00 |
| Stephanie Grambling |
Morgan Stanley |
Raises |
Equal-Weight |
$53.00 |
$51.00 |
| Shaun Kelley |
B of A Securities |
Raises |
Buy |
$57.00 |
$52.00 |
| Joseph Greff |
JP Morgan |
Raises |
Overweight |
$69.00 |
$63.00 |
| Ben Chaiken |
Mizuho |
Announces |
Buy |
$69.00 |
- |
| Stephanie Grambling |
Morgan Stanley |
Raises |
Equal-Weight |
$51.00 |
$48.00 |
| Joseph Greff |
JP Morgan |
Raises |
Overweight |
$63.00 |
$53.00 |
| Brandt Montour |
Barclays |
Raises |
Overweight |
$62.00 |
$60.00 |
| Jordan Bender |
JMP Securities |
Raises |
Market Outperform |
$61.00 |
$55.00 |
| Joseph Stauff |
Susquehanna |
Raises |
Positive |
$66.00 |
$52.00 |
| Daniel Politzer |
Wells Fargo |
Raises |
Overweight |
$62.00 |
$57.00 |
| Carlo Santarelli |
Deutsche Bank |
Raises |
Buy |
$62.00 |
$54.00 |
Key Insights:
- Action Taken: Analysts adapt their recommendations to changing market conditions and company performance. Whether they 'Maintain', 'Raise' or 'Lower' their stance, it reflects their response to recent developments related to Red Rock Resorts. This information provides a snapshot of how analysts perceive the current state of the company.
- Rating: Analysts assign qualitative assessments to stocks, ranging from 'Outperform' to 'Underperform'. These ratings convey the analysts' expectations for the relative performance of Red Rock Resorts compared to the broader market.
- Price Targets: Gaining insights, analysts provide estimates for the future value of Red Rock Resorts's stock. This comparison reveals trends in analysts' expectations over time.
Assessing these analyst evaluations alongside crucial financial indicators can provide a comprehensive overview of Red Rock Resorts's market position. Stay informed and make well-judged decisions with the assistance of our Ratings Table.
Stay up to date on Red Rock Resorts analyst ratings.
About Red Rock Resorts
Red Rock Resorts Inc along with its subsidiary is a gaming, development, and management company. The company mainly develops strategically located casino and entertainment properties. It generates a majority of its revenue from Casino.
Red Rock Resorts: A Financial Overview
Market Capitalization Analysis: The company's market capitalization is below the industry average, suggesting that it is relatively smaller compared to peers. This could be due to various factors, including perceived growth potential or operational scale.
Revenue Growth: Red Rock Resorts's revenue growth over a period of 3 months has been noteworthy. As of 31 December, 2023, the company achieved a revenue growth rate of approximately 8.75%. This indicates a substantial increase in the company's top-line earnings. When compared to others in the Consumer Discretionary sector, the company faces challenges, achieving a growth rate lower than the average among peers.
Net Margin: Red Rock Resorts's financial strength is reflected in its exceptional net margin, which exceeds industry averages. With a remarkable net margin of 12.17%, the company showcases strong profitability and effective cost management.
Return on Equity (ROE): Red Rock Resorts's ROE excels beyond industry benchmarks, reaching 38.54%. This signifies robust financial management and efficient use of shareholder equity capital.
Return on Assets (ROA): The company's ROA is a standout performer, exceeding industry averages. With an impressive ROA of 1.44%, the company showcases effective utilization of assets.
Debt Management: Red Rock Resorts's debt-to-equity ratio surpasses industry norms, standing at 19.75. This suggests the company carries a substantial amount of debt, posing potential financial challenges.
Analyst Ratings: Simplified
Analyst ratings serve as essential indicators of stock performance, provided by experts in banking and financial systems. These specialists diligently analyze company financial statements, participate in conference calls, and engage with insiders to generate quarterly ratings for individual stocks.
Analysts may enhance their evaluations by incorporating forecasts for metrics like growth estimates, earnings, and revenue, delivering additional guidance to investors. It is vital to acknowledge that, although experts in stocks and sectors, analysts are human and express their opinions when providing insights.
This article was generated by Benzinga's automated content engine and reviewed by an editor.
Posted In: RRR