A Glimpse Into The Expert Outlook On Casey's General Stores Through 10 Analysts
Author: Benzinga Insights | April 16, 2024 12:01pm
10 analysts have expressed a variety of opinions on Casey's General Stores (NASDAQ:CASY) over the past quarter, offering a diverse set of opinions from bullish to bearish.
The table below summarizes their recent ratings, showcasing the evolving sentiments within the past 30 days and comparing them to the preceding months.
|
Bullish |
Somewhat Bullish |
Indifferent |
Somewhat Bearish |
Bearish |
| Total Ratings |
2 |
6 |
2 |
0 |
0 |
| Last 30D |
0 |
1 |
0 |
0 |
0 |
| 1M Ago |
0 |
2 |
0 |
0 |
0 |
| 2M Ago |
2 |
3 |
2 |
0 |
0 |
| 3M Ago |
0 |
0 |
0 |
0 |
0 |
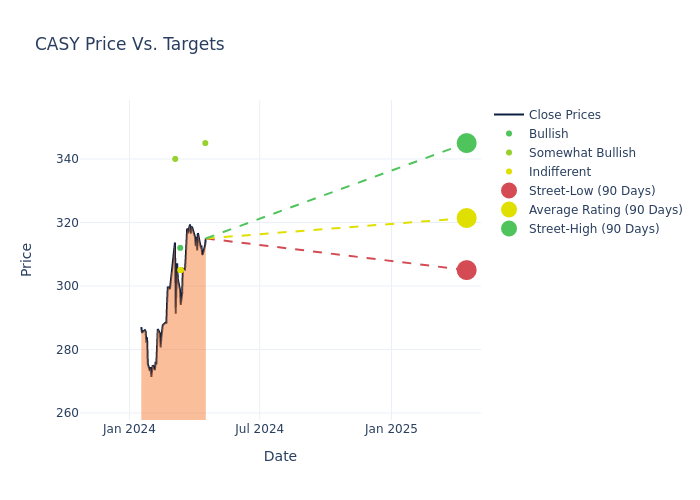
Analysts have set 12-month price targets for Casey's General Stores, revealing an average target of $331.1, a high estimate of $355.00, and a low estimate of $305.00. This current average has increased by 1.39% from the previous average price target of $326.57.
Interpreting Analyst Ratings: A Closer Look
An in-depth analysis of recent analyst actions unveils how financial experts perceive Casey's General Stores. The following summary outlines key analysts, their recent evaluations, and adjustments to ratings and price targets.
| Analyst |
Analyst Firm |
Action Taken |
Rating |
Current Price Target |
Prior Price Target |
| Michael Montani |
Evercore ISI Group |
Lowers |
Outperform |
$345.00 |
$350.00 |
| Michael Montani |
Evercore ISI Group |
Lowers |
Outperform |
$350.00 |
$355.00 |
| Michael Montani |
Evercore ISI Group |
Raises |
Outperform |
$355.00 |
$345.00 |
| Kelly Bania |
BMO Capital |
Raises |
Market Perform |
$305.00 |
$290.00 |
| Michael Montani |
Evercore ISI Group |
Lowers |
Outperform |
$342.00 |
$345.00 |
| Irene Nattel |
RBC Capital |
Raises |
Sector Perform |
$305.00 |
$296.00 |
| John Lawrence |
Benchmark |
Maintains |
Buy |
$312.00 |
- |
| John Lawrence |
Benchmark |
Maintains |
Buy |
$312.00 |
- |
| Michael Montani |
Evercore ISI Group |
Announces |
Outperform |
$345.00 |
- |
| Anthony Bonadio |
Wells Fargo |
Raises |
Overweight |
$340.00 |
$305.00 |
Key Insights:
- Action Taken: Responding to changing market dynamics and company performance, analysts update their recommendations. Whether they 'Maintain', 'Raise', or 'Lower' their stance, it signifies their response to recent developments related to Casey's General Stores. This offers insight into analysts' perspectives on the current state of the company.
- Rating: Analysts assign qualitative assessments to stocks, ranging from 'Outperform' to 'Underperform'. These ratings convey the analysts' expectations for the relative performance of Casey's General Stores compared to the broader market.
- Price Targets: Gaining insights, analysts provide estimates for the future value of Casey's General Stores's stock. This comparison reveals trends in analysts' expectations over time.
Analyzing these analyst evaluations alongside relevant financial metrics can provide a comprehensive view of Casey's General Stores's market position. Stay informed and make data-driven decisions with the assistance of our Ratings Table.
Stay up to date on Casey's General Stores analyst ratings.
All You Need to Know About Casey's General Stores
Casey's General Stores Inc owns and operates over 2,500 convenience stores in multiple Midwestern states of the U.S. The stores provide self-service gasoline, grocery items, and processed foods such as pizza, donuts, and sandwiches. Casey's operates its own distribution centres, delivering its in-store products and fuel supplies. The company owns of its real estate, including nearly all of the stores, distribution centres, and some of its subsidiaries' facilities. More than half of the company's stores are located in areas with populations of fewer than 5,000 people.
Casey's General Stores's Financial Performance
Market Capitalization Analysis: With an elevated market capitalization, the company stands out above industry averages, showcasing substantial size and market acknowledgment.
Decline in Revenue: Over the 3 months period, Casey's General Stores faced challenges, resulting in a decline of approximately -0.1% in revenue growth as of 31 January, 2024. This signifies a reduction in the company's top-line earnings. As compared to its peers, the revenue growth lags behind its industry peers. The company achieved a growth rate lower than the average among peers in Consumer Staples sector.
Net Margin: Casey's General Stores's net margin surpasses industry standards, highlighting the company's exceptional financial performance. With an impressive 2.61% net margin, the company effectively manages costs and achieves strong profitability.
Return on Equity (ROE): Casey's General Stores's ROE excels beyond industry benchmarks, reaching 2.97%. This signifies robust financial management and efficient use of shareholder equity capital.
Return on Assets (ROA): The company's ROA is a standout performer, exceeding industry averages. With an impressive ROA of 1.4%, the company showcases effective utilization of assets.
Debt Management: Casey's General Stores's debt-to-equity ratio is below industry norms, indicating a sound financial structure with a ratio of 0.56.
The Significance of Analyst Ratings Explained
Analyst ratings serve as essential indicators of stock performance, provided by experts in banking and financial systems. These specialists diligently analyze company financial statements, participate in conference calls, and engage with insiders to generate quarterly ratings for individual stocks.
Analysts may supplement their ratings with predictions for metrics like growth estimates, earnings, and revenue, offering investors a more comprehensive outlook. However, investors should be mindful that analysts, like any human, can have subjective perspectives influencing their forecasts.
This article was generated by Benzinga's automated content engine and reviewed by an editor.
Posted In: CASY