Industry Comparison: Evaluating Adobe Against Competitors In Software Industry
Author: Benzinga Insights | April 11, 2024 11:01am
In today's rapidly changing and highly competitive business world, it is vital for investors and industry enthusiasts to carefully assess companies. In this article, we will perform a comprehensive industry comparison, evaluating Adobe (NASDAQ:ADBE) against its key competitors in the Software industry. By analyzing important financial metrics, market position, and growth prospects, we aim to provide valuable insights for investors and shed light on company's performance within the industry.
Adobe Background
Adobe provides content creation, document management, and digital marketing and advertising software and services to creative professionals and marketers for creating, managing, delivering, measuring, optimizing and engaging with compelling content multiple operating systems, devices and media. The company operates with three segments: digital media content creation, digital experience for marketing solutions, and publishing for legacy products (less than 5% of revenue).
| Company |
P/E |
P/B |
P/S |
ROE |
EBITDA (in billions) |
Gross Profit (in billions) |
Revenue Growth |
| Adobe Inc |
46.54 |
14.12 |
11.20 |
3.88% |
$1.21 |
$4.59 |
11.32% |
| Salesforce Inc |
71.34 |
4.87 |
8.46 |
2.46% |
$2.75 |
$7.14 |
10.77% |
| SAP SE |
55.07 |
4.59 |
6.41 |
3.05% |
$2.32 |
$6.2 |
5.02% |
| Intuit Inc |
64.16 |
10.40 |
11.80 |
2.08% |
$0.6 |
$2.53 |
11.34% |
| Synopsys Inc |
61.95 |
12.83 |
14.21 |
7.01% |
$0.53 |
$1.32 |
21.15% |
| Cadence Design Systems Inc |
79.74 |
24.39 |
20.31 |
9.94% |
$0.41 |
$0.96 |
18.75% |
| Workday Inc |
51.22 |
8.72 |
9.75 |
16.16% |
$0.24 |
$1.46 |
16.75% |
| Roper Technologies Inc |
42.07 |
3.29 |
9.32 |
2.26% |
$0.72 |
$1.13 |
12.76% |
| Autodesk Inc |
57.04 |
27.56 |
9.39 |
16.9% |
$0.35 |
$1.34 |
3.89% |
| Palantir Technologies Inc |
249.11 |
14.27 |
23.15 |
2.8% |
$0.11 |
$0.5 |
19.61% |
| Datadog Inc |
898.86 |
20.62 |
20.71 |
2.82% |
$0.07 |
$0.48 |
25.62% |
| Ansys Inc |
59.25 |
5.48 |
13.07 |
5.29% |
$0.37 |
$0.74 |
15.99% |
| MicroStrategy Inc |
59.26 |
12.27 |
52.27 |
5.93% |
$-0.04 |
$0.1 |
-6.09% |
| AppLovin Corp |
77.94 |
20.16 |
8.44 |
14.58% |
$0.37 |
$0.68 |
35.73% |
| PTC Inc |
91.86 |
7.75 |
9.98 |
2.42% |
$0.16 |
$0.44 |
18.09% |
| Zoom Video Communications Inc |
30.06 |
2.39 |
4.24 |
3.87% |
$0.2 |
$0.87 |
2.56% |
| Tyler Technologies Inc |
106.15 |
5.95 |
9.02 |
1.34% |
$0.09 |
$0.21 |
6.35% |
| NICE Ltd |
47.47 |
4.58 |
6.76 |
2.49% |
$0.19 |
$0.42 |
9.61% |
| Bentley Systems Inc |
49.87 |
16.79 |
13.50 |
22.81% |
$0.05 |
$0.24 |
8.26% |
| Manhattan Associates Inc |
84.50 |
52.72 |
16.06 |
19.96% |
$0.06 |
$0.13 |
20.27% |
| Dynatrace Inc |
71.89 |
7.34 |
10.34 |
2.3% |
$0.05 |
$0.3 |
22.74% |
| Average |
115.44 |
13.35 |
13.86 |
7.32% |
$0.48 |
$1.36 |
13.96% |
When closely examining Adobe, the following trends emerge:
-
At 46.54, the stock's Price to Earnings ratio is 0.4x less than the industry average, suggesting favorable growth potential.
-
It could be trading at a premium in relation to its book value, as indicated by its Price to Book ratio of 14.12 which exceeds the industry average by 1.06x.
-
With a relatively low Price to Sales ratio of 11.2, which is 0.81x the industry average, the stock might be considered undervalued based on sales performance.
-
The company has a lower Return on Equity (ROE) of 3.88%, which is 3.44% below the industry average. This indicates potential inefficiency in utilizing equity to generate profits, which could be attributed to various factors.
-
Compared to its industry, the company has higher Earnings Before Interest, Taxes, Depreciation, and Amortization (EBITDA) of $1.21 Billion, which is 2.52x above the industry average, indicating stronger profitability and robust cash flow generation.
-
The company has higher gross profit of $4.59 Billion, which indicates 3.37x above the industry average, indicating stronger profitability and higher earnings from its core operations.
-
With a revenue growth of 11.32%, which is much lower than the industry average of 13.96%, the company is experiencing a notable slowdown in sales expansion.
Debt To Equity Ratio
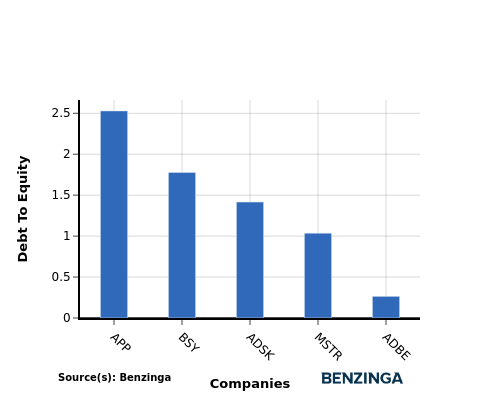
The debt-to-equity (D/E) ratio is a financial metric that helps determine the level of financial risk associated with a company's capital structure.
Considering the debt-to-equity ratio in industry comparisons allows for a concise evaluation of a company's financial health and risk profile, aiding in informed decision-making.
In terms of the Debt-to-Equity ratio, Adobe stands in comparison with its top 4 peers, leading to the following comparisons:
-
In terms of the debt-to-equity ratio, Adobe has a lower level of debt compared to its top 4 peers, indicating a stronger financial position.
-
This implies that the company relies less on debt financing and has a more favorable balance between debt and equity with a lower debt-to-equity ratio of 0.26.
Key Takeaways
For Adobe in the Software industry, the PE ratio is low compared to peers, indicating potential undervaluation. The PB ratio is high, suggesting investors are willing to pay a premium for its assets. The PS ratio is low, implying a favorable sales valuation. In terms of ROE, Adobe shows lower profitability compared to peers. However, its high EBITDA and gross profit signify strong operational performance. The low revenue growth may indicate challenges in expanding market share.
This article was generated by Benzinga's automated content engine and reviewed by an editor.
Posted In: ADBE


