Competitor Analysis: Evaluating Palo Alto Networks And Competitors In Software Industry
Author: Benzinga Insights | April 10, 2024 11:00am
In the ever-changing and fiercely competitive business landscape, conducting thorough company analysis is crucial for investors and industry experts. In this article, we will undertake a comprehensive industry comparison, evaluating Palo Alto Networks (NASDAQ:PANW) and its primary competitors in the Software industry. By closely examining key financial metrics, market position, and growth prospects, our aim is to provide valuable insights for investors and shed light on company's performance within the industry.
Palo Alto Networks Background
Palo Alto Networks is a platform-based cybersecurity vendor with product offerings covering network security, cloud security, and security operations. The California-based firm has more than 85,000 customers across the world, including more than three fourths of the Global 2000.
| Company |
P/E |
P/B |
P/S |
ROE |
EBITDA (in billions) |
Gross Profit (in billions) |
Revenue Growth |
| Palo Alto Networks Inc |
43.21 |
20.70 |
13.04 |
53.52% |
$0.21 |
$1.48 |
19.33% |
| Microsoft Corp |
38.54 |
13.29 |
13.98 |
9.53% |
$33.39 |
$42.4 |
17.58% |
| Oracle Corp |
32.51 |
60.23 |
6.60 |
50.61% |
$5.3 |
$9.41 |
7.11% |
| ServiceNow Inc |
92.90 |
21.06 |
17.93 |
3.98% |
$0.51 |
$1.92 |
25.62% |
| CrowdStrike Holdings Inc |
839.92 |
32.62 |
24.78 |
2.48% |
$0.12 |
$0.64 |
32.63% |
| Gen Digital Inc |
10.25 |
5.97 |
3.85 |
5.96% |
$0.47 |
$0.77 |
1.6% |
| Dolby Laboratories Inc |
43.43 |
3.40 |
6.37 |
2.85% |
$0.09 |
$0.28 |
-5.78% |
| Qualys Inc |
41.54 |
16.81 |
11.35 |
11.75% |
$0.05 |
$0.12 |
10.49% |
| Teradata Corp |
63.26 |
27.92 |
2.16 |
-5.45% |
$0.06 |
$0.28 |
1.11% |
| N-able Inc |
98.92 |
3.34 |
5.67 |
1.35% |
$0.03 |
$0.09 |
13.22% |
| Progress Software Corp |
33.09 |
4.80 |
3.21 |
4.91% |
$0.06 |
$0.15 |
12.46% |
| Average |
129.44 |
18.94 |
9.59 |
8.8% |
$4.01 |
$5.61 |
11.6% |
Through an analysis of Palo Alto Networks, we can infer the following trends:
-
At 43.21, the stock's Price to Earnings ratio is 0.33x less than the industry average, suggesting favorable growth potential.
-
It could be trading at a premium in relation to its book value, as indicated by its Price to Book ratio of 20.7 which exceeds the industry average by 1.09x.
-
With a relatively high Price to Sales ratio of 13.04, which is 1.36x the industry average, the stock might be considered overvalued based on sales performance.
-
The company has a higher Return on Equity (ROE) of 53.52%, which is 44.72% above the industry average. This suggests efficient use of equity to generate profits and demonstrates profitability and growth potential.
-
With lower Earnings Before Interest, Taxes, Depreciation, and Amortization (EBITDA) of $210 Million, which is 0.05x below the industry average, the company may face lower profitability or financial challenges.
-
The gross profit of $1.48 Billion is 0.26x below that of its industry, suggesting potential lower revenue after accounting for production costs.
-
The company's revenue growth of 19.33% is notably higher compared to the industry average of 11.6%, showcasing exceptional sales performance and strong demand for its products or services.
Debt To Equity Ratio
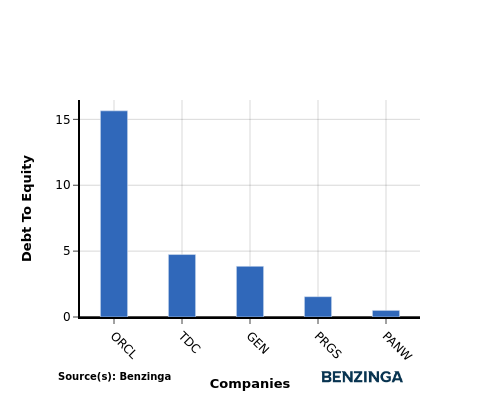
The debt-to-equity (D/E) ratio is a financial metric that helps determine the level of financial risk associated with a company's capital structure.
Considering the debt-to-equity ratio in industry comparisons allows for a concise evaluation of a company's financial health and risk profile, aiding in informed decision-making.
In terms of the Debt-to-Equity ratio, Palo Alto Networks stands in comparison with its top 4 peers, leading to the following comparisons:
-
Palo Alto Networks has a stronger financial position compared to its top 4 peers, as evidenced by its lower debt-to-equity ratio of 0.5.
-
This suggests that the company has a more favorable balance between debt and equity, which can be perceived as a positive indicator by investors.
Key Takeaways
For Palo Alto Networks in the Software industry, the PE ratio is low compared to peers, indicating potential undervaluation. The high PB and PS ratios suggest the market values the company's assets and sales highly relative to competitors. With a high ROE, Palo Alto Networks is generating strong returns for shareholders. However, the low EBITDA and gross profit may indicate challenges in operational efficiency. The high revenue growth reflects a positive outlook for the company's future performance compared to industry peers.
This article was generated by Benzinga's automated content engine and reviewed by an editor.
Posted In: PANW


