Peeling Back The Layers: Exploring Chemours Through Analyst Insights
Author: Benzinga Insights | April 02, 2024 04:01pm
Ratings for Chemours (NYSE:CC) were provided by 4 analysts in the past three months, showcasing a mix of bullish and bearish perspectives.
The following table provides a quick overview of their recent ratings, highlighting the changing sentiments over the past 30 days and comparing them to the preceding months.
|
Bullish |
Somewhat Bullish |
Indifferent |
Somewhat Bearish |
Bearish |
| Total Ratings |
0 |
0 |
2 |
2 |
0 |
| Last 30D |
0 |
0 |
1 |
0 |
0 |
| 1M Ago |
0 |
0 |
1 |
0 |
0 |
| 2M Ago |
0 |
0 |
0 |
2 |
0 |
| 3M Ago |
0 |
0 |
0 |
0 |
0 |
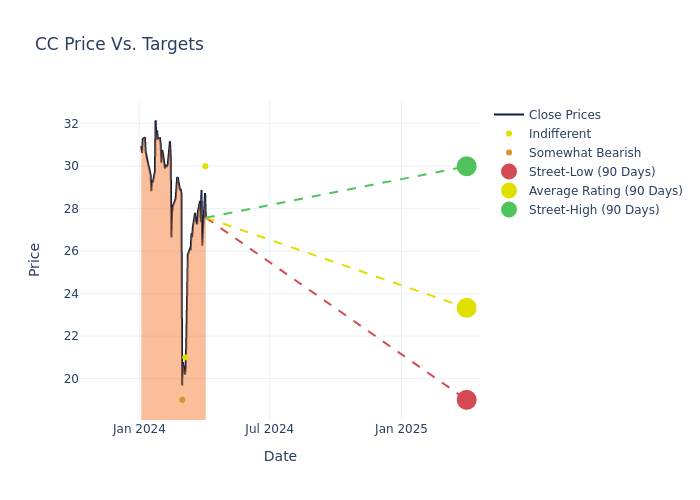
Analysts have recently evaluated Chemours and provided 12-month price targets. The average target is $22.25, accompanied by a high estimate of $30.00 and a low estimate of $19.00. Observing a downward trend, the current average is 44.03% lower than the prior average price target of $39.75.
Investigating Analyst Ratings: An Elaborate Study
A comprehensive examination of how financial experts perceive Chemours is derived from recent analyst actions. The following is a detailed summary of key analysts, their recent evaluations, and adjustments to ratings and price targets.
| Analyst |
Analyst Firm |
Action Taken |
Rating |
Current Price Target |
Prior Price Target |
| Michael Leithead |
Barclays |
Lowers |
Equal-Weight |
$30.00 |
$32.00 |
| Joshua Spector |
UBS |
Lowers |
Neutral |
$21.00 |
$37.00 |
| John McNulty |
BMO Capital |
Lowers |
Underperform |
$19.00 |
$45.00 |
| John McNulty |
BMO Capital |
Lowers |
Underperform |
$19.00 |
$45.00 |
Key Insights:
- Action Taken: In response to dynamic market conditions and company performance, analysts update their recommendations. Whether they 'Maintain', 'Raise', or 'Lower' their stance, it signifies their reaction to recent developments related to Chemours. This insight gives a snapshot of analysts' perspectives on the current state of the company.
- Rating: Analysts unravel qualitative evaluations for stocks, ranging from 'Outperform' to 'Underperform'. These ratings offer insights into expectations for the relative performance of Chemours compared to the broader market.
- Price Targets: Analysts set price targets as an estimate of a stock's future value. Comparing the current and prior price targets provides insight into how analysts' expectations have changed over time. This information can be valuable for investors seeking to understand consensus views on the stock's potential future performance.
For valuable insights into Chemours's market performance, consider these analyst evaluations alongside crucial financial indicators. Stay well-informed and make prudent decisions using our Ratings Table.
Stay up to date on Chemours analyst ratings.
All You Need to Know About Chemours
The Chemours Co is a global provider of chemicals. It delivers customized solutions with a wide range of industrial and specialty chemicals products for various markets including coatings, plastics, refrigeration, air conditioning, etc. The company's operating segments include Titanium Technologies, Thermal & Specialized Solutions, and Advanced Performance Materials. It generates maximum revenue from the Titanium Technologies segment. The Titanium Technologies segment is a producer of TiO2 pigment, a premium white pigment used to deliver whiteness, brightness, opacity, durability, efficiency, and protection across a variety of applications. Geographically, the company derives a majority of its revenue from North America.
Understanding the Numbers: Chemours's Finances
Market Capitalization: Positioned above industry average, the company's market capitalization underscores its superiority in size, indicative of a strong market presence.
Revenue Growth: Chemours displayed positive results in 3 months. As of 31 December, 2023, the company achieved a solid revenue growth rate of approximately 1.72%. This indicates a notable increase in the company's top-line earnings. When compared to others in the Materials sector, the company excelled with a growth rate higher than the average among peers.
Net Margin: Chemours's net margin surpasses industry standards, highlighting the company's exceptional financial performance. With an impressive -1.91% net margin, the company effectively manages costs and achieves strong profitability.
Return on Equity (ROE): The company's ROE is below industry benchmarks, signaling potential difficulties in efficiently using equity capital. With an ROE of -3.49%, the company may need to address challenges in generating satisfactory returns for shareholders.
Return on Assets (ROA): Chemours's ROA is below industry standards, pointing towards difficulties in efficiently utilizing assets. With an ROA of -0.32%, the company may encounter challenges in delivering satisfactory returns from its assets.
Debt Management: Chemours's debt-to-equity ratio stands notably higher than the industry average, reaching 5.83. This indicates a heavier reliance on borrowed funds, raising concerns about financial leverage.
Analyst Ratings: What Are They?
Analyst ratings serve as essential indicators of stock performance, provided by experts in banking and financial systems. These specialists diligently analyze company financial statements, participate in conference calls, and engage with insiders to generate quarterly ratings for individual stocks.
Some analysts publish their predictions for metrics such as growth estimates, earnings, and revenue to provide additional guidance with their ratings. When using analyst ratings, it is important to keep in mind that stock and sector analysts are also human and are only offering their opinions to investors.
If you want to keep track of which analysts are outperforming others, you can view updated analyst ratings along withanalyst success scores in Benzinga Pro.
This article was generated by Benzinga's automated content engine and reviewed by an editor.
Posted In: CC