Industry Comparison: Evaluating Analog Devices Against Competitors In Semiconductors & Semiconductor Equipment Industry
Author: Benzinga Insights | March 28, 2024 11:00am
In the fast-paced and cutthroat world of business, conducting thorough company analysis is essential for investors and industry experts. In this article, we will undertake a comprehensive industry comparison, evaluating Analog Devices (NASDAQ:ADI) in comparison to its major competitors within the Semiconductors & Semiconductor Equipment industry. By analyzing crucial financial metrics, market position, and growth potential, our objective is to provide valuable insights for investors and offer a deeper understanding of company's performance in the industry.
Analog Devices Background
Analog Devices is a leading analog, mixed signal, and digital signal processing chipmaker. The firm has a significant market share lead in converter chips, which are used to translate analog signals to digital and vice versa. The company serves tens of thousands of customers, and more than half of its chip sales are made to industrial and automotive end markets. Analog Devices' chips are also incorporated into wireless infrastructure equipment.
| Company |
P/E |
P/B |
P/S |
ROE |
EBITDA (in billions) |
Gross Profit (in billions) |
Revenue Growth |
| Analog Devices Inc |
34.53 |
2.70 |
8.40 |
1.3% |
$1.12 |
$1.47 |
-22.68% |
| NVIDIA Corp |
75.65 |
52.50 |
36.95 |
32.23% |
$14.56 |
$16.79 |
265.28% |
| Broadcom Inc |
49.01 |
8.70 |
14.81 |
2.81% |
$4.61 |
$7.38 |
34.17% |
| Advanced Micro Devices Inc |
338.85 |
5.19 |
12.87 |
1.2% |
$1.22 |
$2.91 |
10.16% |
| Qualcomm Inc |
24.13 |
8.19 |
5.24 |
12.4% |
$3.58 |
$5.62 |
4.99% |
| Intel Corp |
109.42 |
1.75 |
3.40 |
2.57% |
$5.57 |
$7.05 |
9.71% |
| Texas Instruments Inc |
24.45 |
9.31 |
9.04 |
8.14% |
$1.98 |
$2.43 |
-12.7% |
| ARM Holdings PLC |
1519.37 |
25.81 |
43.96 |
1.78% |
$0.18 |
$0.79 |
13.81% |
| Microchip Technology Inc |
20.84 |
6.81 |
5.74 |
5.97% |
$0.75 |
$1.12 |
-18.6% |
| STMicroelectronics NV |
9.86 |
2.37 |
2.40 |
6.69% |
$1.5 |
$1.95 |
-3.21% |
| Monolithic Power Systems Inc |
76.89 |
15.99 |
18.04 |
4.85% |
$0.12 |
$0.25 |
-1.3% |
| ON Semiconductor Corp |
15.46 |
4.15 |
4.09 |
7.37% |
$0.79 |
$0.94 |
-4.06% |
| GLOBALFOUNDRIES Inc |
28.27 |
2.58 |
3.89 |
2.53% |
$0.73 |
$0.53 |
0.11% |
| ASE Technology Holding Co Ltd |
24.43 |
2.54 |
1.31 |
3.17% |
$28.28 |
$25.76 |
4.16% |
| United Microelectronics Corp |
9.14 |
1.82 |
2.69 |
4.72% |
$29.0 |
$20.46 |
-24.3% |
| First Solar Inc |
21.64 |
2.68 |
5.42 |
5.38% |
$0.47 |
$0.5 |
15.58% |
| Skyworks Solutions Inc |
19.13 |
2.78 |
3.73 |
3.76% |
$0.37 |
$0.51 |
-9.61% |
| Lattice Semiconductor Corp |
43.03 |
15.82 |
15.10 |
14.98% |
$0.05 |
$0.12 |
-3.05% |
| Universal Display Corp |
39.56 |
5.49 |
13.86 |
4.36% |
$0.08 |
$0.12 |
-6.34% |
| MACOM Technology Solutions Holdings Inc |
91.87 |
6.72 |
10.96 |
1.27% |
$0.03 |
$0.09 |
-12.75% |
| Rambus Inc |
20.97 |
6.60 |
15.18 |
5.87% |
$0.07 |
$0.1 |
-0.12% |
| Average |
128.1 |
9.39 |
11.43 |
6.6% |
$4.7 |
$4.77 |
13.1% |
By closely examining Analog Devices, we can identify the following trends:
-
A Price to Earnings ratio of 34.53 significantly below the industry average by 0.27x suggests undervaluation. This can make the stock appealing for those seeking growth.
-
Considering a Price to Book ratio of 2.7, which is well below the industry average by 0.29x, the stock may be undervalued based on its book value compared to its peers.
-
Based on its sales performance, the stock could be deemed undervalued with a Price to Sales ratio of 8.4, which is 0.73x the industry average.
-
With a Return on Equity (ROE) of 1.3% that is 5.3% below the industry average, it appears that the company exhibits potential inefficiency in utilizing equity to generate profits.
-
The Earnings Before Interest, Taxes, Depreciation, and Amortization (EBITDA) of $1.12 Billion is 0.24x below the industry average, suggesting potential lower profitability or financial challenges.
-
The gross profit of $1.47 Billion is 0.31x below that of its industry, suggesting potential lower revenue after accounting for production costs.
-
With a revenue growth of -22.68%, which is much lower than the industry average of 13.1%, the company is experiencing a notable slowdown in sales expansion.
Debt To Equity Ratio
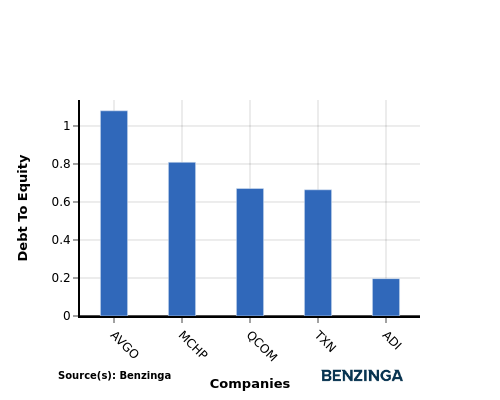
The debt-to-equity (D/E) ratio measures the financial leverage of a company by evaluating its debt relative to its equity.
Considering the debt-to-equity ratio in industry comparisons allows for a concise evaluation of a company's financial health and risk profile, aiding in informed decision-making.
In terms of the Debt-to-Equity ratio, Analog Devices stands in comparison with its top 4 peers, leading to the following comparisons:
-
Analog Devices is in a relatively stronger financial position compared to its top 4 peers, as evidenced by its lower debt-to-equity ratio of 0.2.
-
This implies that the company relies less on debt financing and has a more favorable balance between debt and equity.
Key Takeaways
For Analog Devices, the PE, PB, and PS ratios are all low compared to industry peers, indicating potential undervaluation. However, the low ROE, EBITDA, gross profit, and revenue growth suggest weaker financial performance relative to competitors in the Semiconductors & Semiconductor Equipment sector.
This article was generated by Benzinga's automated content engine and reviewed by an editor.
Posted In: ADI


