Assessing Kimberly-Clark: Insights From 7 Financial Analysts
Author: Benzinga Insights | March 28, 2024 10:00am
Providing a diverse range of perspectives from bullish to bearish, 7 analysts have published ratings on Kimberly-Clark (NYSE:KMB) in the last three months.
The table below provides a snapshot of their recent ratings, showcasing how sentiments have evolved over the past 30 days and comparing them to the preceding months.
|
Bullish |
Somewhat Bullish |
Indifferent |
Somewhat Bearish |
Bearish |
| Total Ratings |
1 |
1 |
4 |
1 |
0 |
| Last 30D |
0 |
1 |
1 |
0 |
0 |
| 1M Ago |
1 |
0 |
0 |
0 |
0 |
| 2M Ago |
0 |
0 |
0 |
0 |
0 |
| 3M Ago |
0 |
0 |
3 |
1 |
0 |
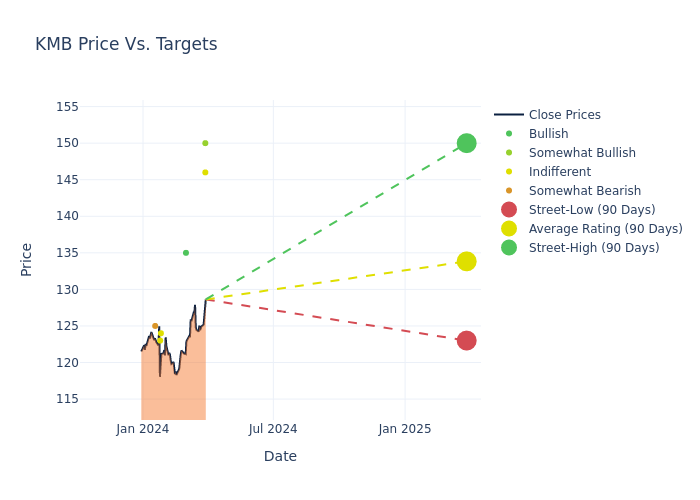
Analysts have recently evaluated Kimberly-Clark and provided 12-month price targets. The average target is $133.0, accompanied by a high estimate of $150.00 and a low estimate of $123.00. Marking an increase of 3.79%, the current average surpasses the previous average price target of $128.14.
Interpreting Analyst Ratings: A Closer Look
An in-depth analysis of recent analyst actions unveils how financial experts perceive Kimberly-Clark. The following summary outlines key analysts, their recent evaluations, and adjustments to ratings and price targets.
| Analyst |
Analyst Firm |
Action Taken |
Rating |
Current Price Target |
Prior Price Target |
| Javier Escalante |
Evercore ISI Group |
Raises |
Outperform |
$150.00 |
$133.00 |
| Alejandro Zamacona |
HSBC |
Raises |
Hold |
$146.00 |
$134.00 |
| Jason English |
Goldman Sachs |
Maintains |
Buy |
$135.00 |
$135.00 |
| Lauren Lieberman |
Barclays |
Lowers |
Equal-Weight |
$124.00 |
$128.00 |
| Nik Modi |
RBC Capital |
Lowers |
Sector Perform |
$123.00 |
$125.00 |
| Andrea Teixeira |
JP Morgan |
Raises |
Underweight |
$125.00 |
$119.00 |
| Lauren Lieberman |
Barclays |
Raises |
Equal-Weight |
$128.00 |
$123.00 |
Key Insights:
- Action Taken: Analysts adapt their recommendations to changing market conditions and company performance. Whether they 'Maintain', 'Raise' or 'Lower' their stance, it reflects their response to recent developments related to Kimberly-Clark. This information provides a snapshot of how analysts perceive the current state of the company.
- Rating: Offering a comprehensive view, analysts assess stocks qualitatively, spanning from 'Outperform' to 'Underperform'. These ratings convey expectations for the relative performance of Kimberly-Clark compared to the broader market.
- Price Targets: Delving into movements, analysts provide estimates for the future value of Kimberly-Clark's stock. This analysis reveals shifts in analysts' expectations over time.
Capture valuable insights into Kimberly-Clark's market standing by understanding these analyst evaluations alongside pertinent financial indicators. Stay informed and make strategic decisions with our Ratings Table.
Stay up to date on Kimberly-Clark analyst ratings.
Unveiling the Story Behind Kimberly-Clark
With more than half of sales from personal care and another third from consumer tissue products, Kimberly-Clark sits as a leading manufacturer in the tissue and hygiene realm. Its brand mix includes Huggies, Pull-Ups, Kotex, Depend, Kleenex, and Cottonelle. The firm also operates K-C Professional, which partners with businesses to provide safety and sanitary offerings for the workplace. Kimberly-Clark generates just over of half its sales in North America and more than 10% in Europe, with the rest primarily concentrated in Asia and Latin America.
Kimberly-Clark: Delving into Financials
Market Capitalization: Indicating a reduced size compared to industry averages, the company's market capitalization poses unique challenges.
Positive Revenue Trend: Examining Kimberly-Clark's financials over 3 months reveals a positive narrative. The company achieved a noteworthy revenue growth rate of 0.12% as of 31 December, 2023, showcasing a substantial increase in top-line earnings. In comparison to its industry peers, the company trails behind with a growth rate lower than the average among peers in the Consumer Staples sector.
Net Margin: Kimberly-Clark's net margin excels beyond industry benchmarks, reaching 10.24%. This signifies efficient cost management and strong financial health.
Return on Equity (ROE): Kimberly-Clark's ROE is below industry standards, pointing towards difficulties in efficiently utilizing equity capital. With an ROE of 63.82%, the company may encounter challenges in delivering satisfactory returns for shareholders.
Return on Assets (ROA): Kimberly-Clark's ROA excels beyond industry benchmarks, reaching 2.95%. This signifies efficient management of assets and strong financial health.
Debt Management: Kimberly-Clark's debt-to-equity ratio is below the industry average. With a ratio of 8.87, the company relies less on debt financing, maintaining a healthier balance between debt and equity, which can be viewed positively by investors.
The Basics of Analyst Ratings
Ratings come from analysts, or specialists within banking and financial systems that report for specific stocks or defined sectors (typically once per quarter for each stock). Analysts usually derive their information from company conference calls and meetings, financial statements, and conversations with important insiders to reach their decisions.
Some analysts publish their predictions for metrics such as growth estimates, earnings, and revenue to provide additional guidance with their ratings. When using analyst ratings, it is important to keep in mind that stock and sector analysts are also human and are only offering their opinions to investors.
If you want to keep track of which analysts are outperforming others, you can view updated analyst ratings along withanalyst success scores in Benzinga Pro.
This article was generated by Benzinga's automated content engine and reviewed by an editor.
Posted In: KMB