In-Depth Examination Of 7 Analyst Recommendations For Boston Props
Author: Benzinga Insights | March 27, 2024 12:00pm
Boston Props (NYSE:BXP) has been analyzed by 7 analysts in the last three months, revealing a diverse range of perspectives from bullish to bearish.
In the table below, you'll find a summary of their recent ratings, revealing the shifting sentiments over the past 30 days and comparing them to the previous months.
|
Bullish |
Somewhat Bullish |
Indifferent |
Somewhat Bearish |
Bearish |
| Total Ratings |
1 |
0 |
6 |
0 |
0 |
| Last 30D |
0 |
0 |
1 |
0 |
0 |
| 1M Ago |
0 |
0 |
1 |
0 |
0 |
| 2M Ago |
0 |
0 |
3 |
0 |
0 |
| 3M Ago |
1 |
0 |
1 |
0 |
0 |
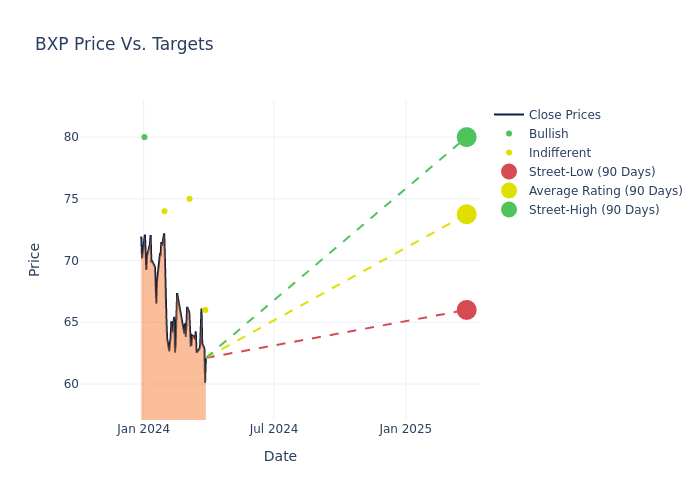
Analysts' evaluations of 12-month price targets offer additional insights, showcasing an average target of $71.86, with a high estimate of $80.00 and a low estimate of $64.00. Observing a 5.41% increase, the current average has risen from the previous average price target of $68.17.
Interpreting Analyst Ratings: A Closer Look
In examining recent analyst actions, we gain insights into how financial experts perceive Boston Props. The following summary outlines key analysts, their recent evaluations, and adjustments to ratings and price targets.
| Analyst |
Analyst Firm |
Action Taken |
Rating |
Current Price Target |
Prior Price Target |
| Anthony Powell |
Barclays |
Lowers |
Equal-Weight |
$66.00 |
$67.00 |
| Michael Lewis |
Truist Securities |
Lowers |
Hold |
$75.00 |
$77.00 |
| Anthony Powell |
Barclays |
Raises |
Equal-Weight |
$67.00 |
$64.00 |
| Omotayo Okusanya |
Deutsche Bank |
Announces |
Hold |
$74.00 |
- |
| Anthony Powell |
Barclays |
Lowers |
Equal-Weight |
$64.00 |
$65.00 |
| Barry Jonas |
Truist Securities |
Lowers |
Hold |
$77.00 |
$79.00 |
| Peter Abramowitz |
Jefferies |
Raises |
Buy |
$80.00 |
$57.00 |
Key Insights:
- Action Taken: Analysts frequently update their recommendations based on evolving market conditions and company performance. Whether they 'Maintain', 'Raise' or 'Lower' their stance, it reflects their reaction to recent developments related to Boston Props. This information provides a snapshot of how analysts perceive the current state of the company.
- Rating: Analysts assign qualitative assessments to stocks, ranging from 'Outperform' to 'Underperform'. These ratings convey the analysts' expectations for the relative performance of Boston Props compared to the broader market.
- Price Targets: Analysts predict movements in price targets, offering estimates for Boston Props's future value. Examining the current and prior targets offers insights into analysts' evolving expectations.
Navigating through these analyst evaluations alongside other financial indicators can contribute to a holistic understanding of Boston Props's market standing. Stay informed and make data-driven decisions with our Ratings Table.
Stay up to date on Boston Props analyst ratings.
Delving into Boston Props's Background
Boston Properties owns over 190 properties consisting of approximately 53 million rentable square feet of space. The portfolio is dominated by office buildings and is spread across major cities such as New York, Boston, San Francisco, Los Angeles, Seattle, and the Washington, D.C., region. The real estate investment trust also owns limited retail, hotel, and residential properties.
Boston Props: A Financial Overview
Market Capitalization Highlights: Above the industry average, the company's market capitalization signifies a significant scale, indicating strong confidence and market prominence.
Revenue Growth: Boston Props displayed positive results in 3 months. As of 31 December, 2023, the company achieved a solid revenue growth rate of approximately 4.95%. This indicates a notable increase in the company's top-line earnings. In comparison to its industry peers, the company stands out with a growth rate higher than the average among peers in the Real Estate sector.
Net Margin: Boston Props's net margin excels beyond industry benchmarks, reaching 14.47%. This signifies efficient cost management and strong financial health.
Return on Equity (ROE): Boston Props's ROE excels beyond industry benchmarks, reaching 2.06%. This signifies robust financial management and efficient use of shareholder equity capital.
Return on Assets (ROA): Boston Props's ROA excels beyond industry benchmarks, reaching 0.47%. This signifies efficient management of assets and strong financial health.
Debt Management: Boston Props's debt-to-equity ratio surpasses industry norms, standing at 2.83. This suggests the company carries a substantial amount of debt, posing potential financial challenges.
Understanding the Relevance of Analyst Ratings
Ratings come from analysts, or specialists within banking and financial systems that report for specific stocks or defined sectors (typically once per quarter for each stock). Analysts usually derive their information from company conference calls and meetings, financial statements, and conversations with important insiders to reach their decisions.
Analysts may supplement their ratings with predictions for metrics like growth estimates, earnings, and revenue, offering investors a more comprehensive outlook. However, investors should be mindful that analysts, like any human, can have subjective perspectives influencing their forecasts.
This article was generated by Benzinga's automated content engine and reviewed by an editor.
Posted In: BXP