In-Depth Analysis: Airbnb Versus Competitors In Hotels, Restaurants & Leisure Industry
Author: Benzinga Insights | March 27, 2024 11:00am
In today's rapidly changing and fiercely competitive business landscape, it is vital for investors and industry enthusiasts to carefully evaluate companies. In this article, we will perform a comprehensive industry comparison, evaluating Airbnb (NASDAQ:ABNB) against its key competitors in the Hotels, Restaurants & Leisure industry. By analyzing important financial metrics, market position, and growth prospects, we aim to provide valuable insights for investors and shed light on company's performance within the industry.
Airbnb Background
Started in 2008, Airbnb is the world's largest online alternative accommodation travel agency, also offering booking services for boutique hotels and experiences. Airbnb's platform offered 7.7 million active accommodation listings as of Dec. 31, 2023. Listings from the company's over 5 million hosts are spread over almost every country in the world. In 2023, 50% of revenue was from the North American region. Transaction fees for online bookings account for all its revenue.
| Company |
P/E |
P/B |
P/S |
ROE |
EBITDA (in billions) |
Gross Profit (in billions) |
Revenue Growth |
| Airbnb Inc |
23.12 |
13.08 |
11.17 |
-4.04% |
$-0.3 |
$1.83 |
16.61% |
| Royal Caribbean Group |
21.69 |
7.44 |
2.79 |
6.06% |
$0.99 |
$1.44 |
27.96% |
| Trip.com Group Ltd |
21.62 |
1.69 |
4.82 |
1.06% |
$1.89 |
$8.31 |
-24.85% |
| Expedia Group Inc |
25.73 |
12.14 |
1.60 |
8.23% |
$0.44 |
$-3.56 |
10.27% |
| Hyatt Hotels Corp |
77.72 |
4.52 |
2.57 |
0.73% |
$0.16 |
$0.29 |
4.53% |
| H World Group Ltd |
81.31 |
6.14 |
5.01 |
9.77% |
$2.2 |
$2.67 |
53.63% |
| Norwegian Cruise Line Holdings Ltd |
51.69 |
28.53 |
1.01 |
-28.8% |
$0.32 |
$0.66 |
30.76% |
| MakeMyTrip Ltd |
151.57 |
8.12 |
10.71 |
2.64% |
$0.04 |
$0.15 |
25.62% |
| Choice Hotels International Inc |
24.71 |
174.39 |
4.11 |
53.34% |
$0.07 |
$0.14 |
-0.99% |
| Wyndham Hotels & Resorts Inc |
22.18 |
8.21 |
4.60 |
6.12% |
$0.13 |
$0.2 |
-3.89% |
| Hilton Grand Vacations Inc |
16.93 |
2.35 |
1.33 |
3.19% |
$0.21 |
$0.33 |
2.72% |
| Marriott Vacations Worldwide Corp |
16.08 |
1.49 |
0.93 |
1.46% |
$0.14 |
$0.47 |
0.51% |
| Atour Lifestyle Holdings Ltd |
41.70 |
10.47 |
4.98 |
15.22% |
$0.36 |
$0.55 |
93.12% |
| Target Hospitality Corp |
6.99 |
2.91 |
2.04 |
10.58% |
$0.07 |
$0.06 |
-17.2% |
| GreenTree Hospitality Group Ltd |
7.11 |
1.54 |
2.15 |
8.1% |
$0.18 |
$0.21 |
15.29% |
| Average |
40.5 |
19.28 |
3.48 |
6.98% |
$0.51 |
$0.85 |
15.53% |
After a detailed analysis of Airbnb, the following trends become apparent:
-
A Price to Earnings ratio of 23.12 significantly below the industry average by 0.57x suggests undervaluation. This can make the stock appealing for those seeking growth.
-
With a Price to Book ratio of 13.08, significantly falling below the industry average by 0.68x, it suggests undervaluation and the possibility of untapped growth prospects.
-
The stock's relatively high Price to Sales ratio of 11.17, surpassing the industry average by 3.21x, may indicate an aspect of overvaluation in terms of sales performance.
-
The Return on Equity (ROE) of -4.04% is 11.02% below the industry average, suggesting potential inefficiency in utilizing equity to generate profits.
-
With lower Earnings Before Interest, Taxes, Depreciation, and Amortization (EBITDA) of $-300 Million, which is -0.59x below the industry average, the company may face lower profitability or financial challenges.
-
Compared to its industry, the company has higher gross profit of $1.83 Billion, which indicates 2.15x above the industry average, indicating stronger profitability and higher earnings from its core operations.
-
The company is experiencing remarkable revenue growth, with a rate of 16.61%, outperforming the industry average of 15.53%.
Debt To Equity Ratio
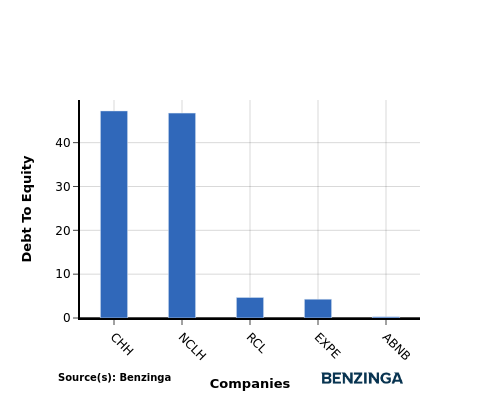
The debt-to-equity (D/E) ratio indicates the proportion of debt and equity used by a company to finance its assets and operations.
Considering the debt-to-equity ratio in industry comparisons allows for a concise evaluation of a company's financial health and risk profile, aiding in informed decision-making.
In light of the Debt-to-Equity ratio, a comparison between Airbnb and its top 4 peers reveals the following information:
-
When comparing the debt-to-equity ratio, Airbnb is in a stronger financial position compared to its top 4 peers.
-
The company has a lower level of debt relative to its equity, indicating a more favorable balance between the two with a lower debt-to-equity ratio of 0.28.
Key Takeaways
For Airbnb in the Hotels, Restaurants & Leisure industry, the PE and PB ratios suggest the company is undervalued compared to its peers. However, the high PS ratio indicates a premium valuation based on revenue. In terms of ROE and EBITDA, Airbnb lags behind its industry peers, reflecting lower profitability and operational efficiency. The high gross profit and revenue growth rates highlight strong financial performance and potential for future growth in the industry sector.
This article was generated by Benzinga's automated content engine and reviewed by an editor.
Posted In: ABNB


