Decoding Newmont's Options Activity: What's the Big Picture?
Author: Benzinga Insights | March 26, 2024 12:45pm
Investors with a lot of money to spend have taken a bearish stance on Newmont (NYSE:NEM).
And retail traders should know.
We noticed this today when the trades showed up on publicly available options history that we track here at Benzinga.
Whether these are institutions or just wealthy individuals, we don't know. But when something this big happens with NEM, it often means somebody knows something is about to happen.
So how do we know what these investors just did?
Today, Benzinga's options scanner spotted 12 uncommon options trades for Newmont.
This isn't normal.
The overall sentiment of these big-money traders is split between 0% bullish and 100%, bearish.
Out of all of the special options we uncovered, 3 are puts, for a total amount of $171,000, and 9 are calls, for a total amount of $369,139.
Projected Price Targets
Based on the trading activity, it appears that the significant investors are aiming for a price territory stretching from $31.0 to $42.5 for Newmont over the recent three months.
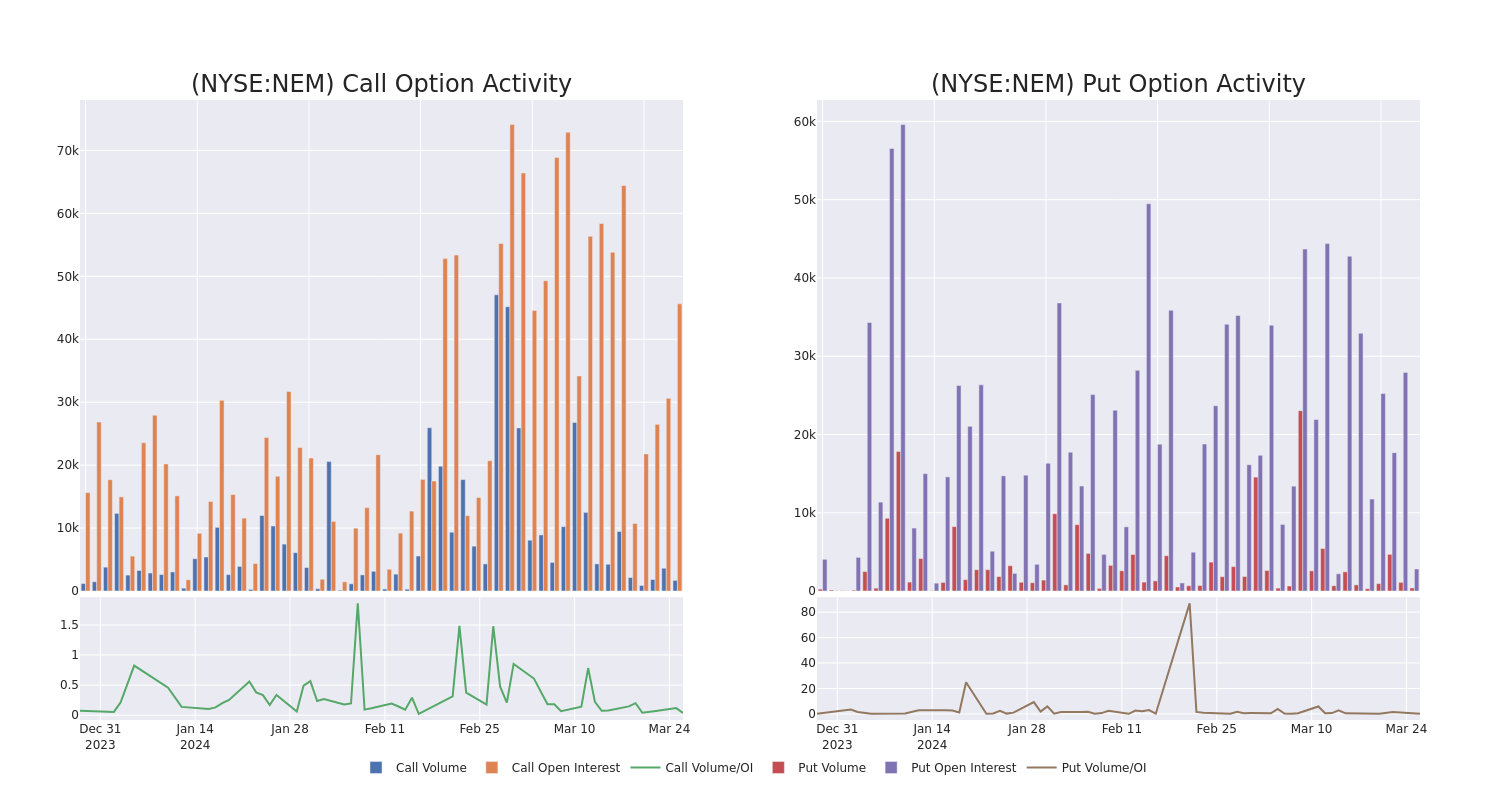
Insights into Volume & Open Interest
Looking at the volume and open interest is a powerful move while trading options. This data can help you track the liquidity and interest for Newmont's options for a given strike price. Below, we can observe the evolution of the volume and open interest of calls and puts, respectively, for all of Newmont's whale trades within a strike price range from $31.0 to $42.5 in the last 30 days.
Newmont Call and Put Volume: 30-Day Overview
Largest Options Trades Observed:
| Symbol |
PUT/CALL |
Trade Type |
Sentiment |
Exp. Date |
Strike Price |
Total Trade Price |
Open Interest |
Volume |
| NEM |
PUT |
SWEEP |
BEARISH |
01/17/25 |
$42.50 |
$114.9K |
2.8K |
166 |
| NEM |
CALL |
TRADE |
NEUTRAL |
05/17/24 |
$35.00 |
$92.5K |
7.0K |
0 |
| NEM |
CALL |
SWEEP |
BEARISH |
09/20/24 |
$35.00 |
$66.3K |
25.8K |
296 |
| NEM |
CALL |
TRADE |
BEARISH |
03/28/24 |
$31.00 |
$33.0K |
715 |
500 |
| NEM |
CALL |
SWEEP |
NEUTRAL |
09/20/24 |
$37.50 |
$32.9K |
2.8K |
0 |
About Newmont
Newmont is the world's largest gold miner. It bought Goldcorp in 2019, combined its Nevada mines in a joint venture with competitor Barrick later that year, and also purchased competitor Newcrest in November 2023. Its portfolio includes 17 wholly or majority owned mines and interests in two joint ventures in the Americas, Africa, Australia and Papua New Guinea. The company is expected to produce roughly 6.9 million ounces of gold in 2024. However, after buying Newcrest, Newmont is likely to sell a number of its higher cost, smaller mines accounting for 20% of forecast sales in 2024. Newmont also produces material amounts of copper, silver, zinc, and lead as byproducts. It had about two decades of gold reserves along with significant byproduct reserves at end December 2023.
After a thorough review of the options trading surrounding Newmont, we move to examine the company in more detail. This includes an assessment of its current market status and performance.
Newmont's Current Market Status
- With a volume of 3,809,942, the price of NEM is up 0.94% at $34.24.
- RSI indicators hint that the underlying stock may be approaching overbought.
- Next earnings are expected to be released in 30 days.
Expert Opinions on Newmont
A total of 1 professional analysts have given their take on this stock in the last 30 days, setting an average price target of $43.5.
- Consistent in their evaluation, an analyst from Scotiabank keeps a Sector Perform rating on Newmont with a target price of $43.
Trading options involves greater risks but also offers the potential for higher profits. Savvy traders mitigate these risks through ongoing education, strategic trade adjustments, utilizing various indicators, and staying attuned to market dynamics. Keep up with the latest options trades for Newmont with Benzinga Pro for real-time alerts.
Posted In: NEM