Looking At Simon Property Group's Recent Unusual Options Activity
Author: Benzinga Insights | March 25, 2024 02:01pm
Financial giants have made a conspicuous bullish move on Simon Property Group. Our analysis of options history for Simon Property Group (NYSE:SPG) revealed 11 unusual trades.
Delving into the details, we found 54% of traders were bullish, while 45% showed bearish tendencies. Out of all the trades we spotted, 9 were puts, with a value of $529,232, and 2 were calls, valued at $79,410.
Expected Price Movements
Analyzing the Volume and Open Interest in these contracts, it seems that the big players have been eyeing a price window from $150.0 to $160.0 for Simon Property Group during the past quarter.
Analyzing Volume & Open Interest
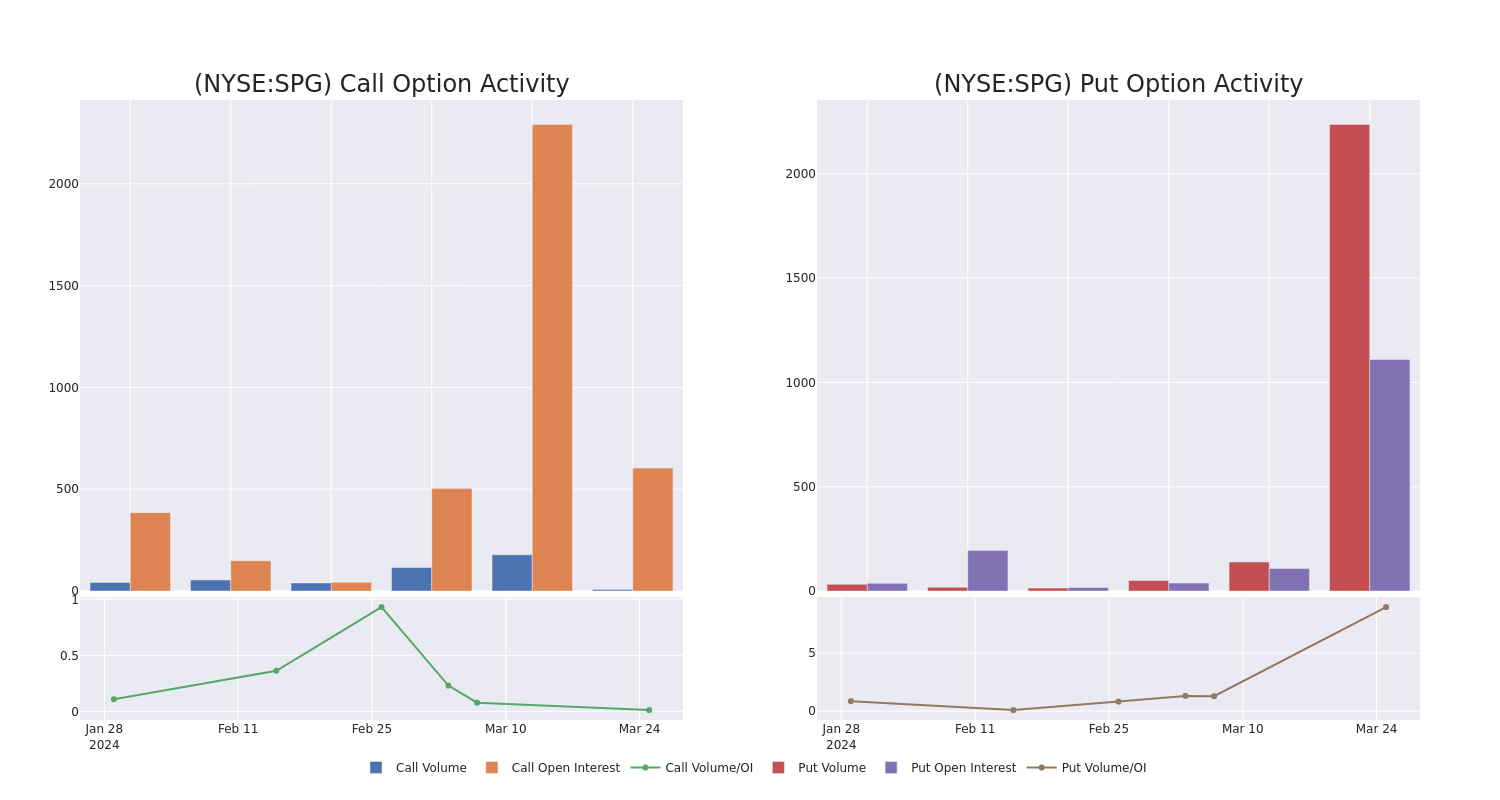
In today's trading context, the average open interest for options of Simon Property Group stands at 342.8, with a total volume reaching 2,243.00. The accompanying chart delineates the progression of both call and put option volume and open interest for high-value trades in Simon Property Group, situated within the strike price corridor from $150.0 to $160.0, throughout the last 30 days.
Simon Property Group Call and Put Volume: 30-Day Overview
Noteworthy Options Activity:
| Symbol |
PUT/CALL |
Trade Type |
Sentiment |
Exp. Date |
Strike Price |
Total Trade Price |
Open Interest |
Volume |
| SPG |
PUT |
SWEEP |
BULLISH |
04/19/24 |
$150.00 |
$125.8K |
930 |
637 |
| SPG |
CALL |
SWEEP |
BULLISH |
05/17/24 |
$155.00 |
$53.5K |
83 |
6 |
| SPG |
PUT |
SWEEP |
BULLISH |
06/21/24 |
$160.00 |
$52.3K |
57 |
90 |
| SPG |
PUT |
SWEEP |
BULLISH |
06/21/24 |
$155.00 |
$51.8K |
123 |
245 |
| SPG |
PUT |
SWEEP |
BULLISH |
06/21/24 |
$155.00 |
$51.8K |
123 |
184 |
About Simon Property Group
Simon Property Group is the second-largest real estate investment trust in the United States. Its portfolio includes an interest in 230 properties: 136 traditional malls, 69 premium outlets, 14 Mills centers (a combination of a traditional mall, outlet center, and big-box retailers), 6 lifestyle centers, and 5 other retail properties. Simon's portfolio averaged $743 in sales per square foot in 2023 compared with $693 in sales per square foot over the 12 months before the pandemic. The company also owns a 21% interest in Klépierre, a European retail company with investments in shopping centers in 16 countries, and joint-venture interests in 33 premium outlets across 11 countries.
In light of the recent options history for Simon Property Group, it's now appropriate to focus on the company itself. We aim to explore its current performance.
Present Market Standing of Simon Property Group
- With a volume of 394,857, the price of SPG is up 0.37% at $152.42.
- RSI indicators hint that the underlying stock may be approaching overbought.
- Next earnings are expected to be released in 36 days.
What The Experts Say On Simon Property Group
A total of 4 professional analysts have given their take on this stock in the last 30 days, setting an average price target of $147.25.
- An analyst from Evercore ISI Group has decided to maintain their In-Line rating on Simon Property Group, which currently sits at a price target of $150.
- Consistent in their evaluation, an analyst from Truist Securities keeps a Hold rating on Simon Property Group with a target price of $147.
- An analyst from Morgan Stanley has decided to maintain their Equal-Weight rating on Simon Property Group, which currently sits at a price target of $145.
- Consistent in their evaluation, an analyst from Truist Securities keeps a Hold rating on Simon Property Group with a target price of $147.
Options are a riskier asset compared to just trading the stock, but they have higher profit potential. Serious options traders manage this risk by educating themselves daily, scaling in and out of trades, following more than one indicator, and following the markets closely.
If you want to stay updated on the latest options trades for Simon Property Group, Benzinga Pro gives you real-time options trades alerts.
Posted In: SPG