Coinbase Consolidates New 27-Month Highs, Looks To Form Bullish Continuation Pattern: A Technical Analysis
Author: Melanie Schaffer | March 22, 2024 02:53pm
Coinbase Global, Inc (NASDAQ:COIN) was trading slightly lower Friday, in tandem with Bitcoin (CRYPTO: BTC) and Ethereum (CRYPTO: ETH), which were retracing over 3% and 5.5%, respectively heading into the weekend.
The crypto trading platform has been holding more strongly than the crypto sector over recent days and on Thursday, Coinbase reached a 27-month high of $276.38, while Bitcoin continued to retrace from the March 13 and March 14 highs by about 10%.
On Friday, JMP analyst Devin Ryan maintained a Market Outperform rating on Coinbase and maintained a $300 price target. The analyst has recognized the company's potential beyond its role as a cryptocurrency exchange since the inception report on Coinbase in 2021. He noted that the exchange business holds significant growth prospects, particularly as the market matures, with increased prices generally aligning positively with activity levels.
Read Next:
Trending:
On Thursday, Cathie Wood’s Ark Invest sold 199,526 Coinbase shares through ARKK, ARKW, and ARKF in a transaction worth $52.27 million despite Coinbase’s strength. Ark Innovation ETF (NYSE:ARKK) has been underperforming the market recently.
Traders who are bearish on ARKK may choose to play the potential downside through AXS Short Innovation Daily ETF (NASDAQ:SARK). SARK is an actively managed fund focused on shorting disruptive innovation by tracking its ETF counterpart, the AXS 2X Innovation ETF (NASDAQ:TARK) inversely.
Want direct analysis? Find me in the BZ Pro lounge! Click here for a free trial.
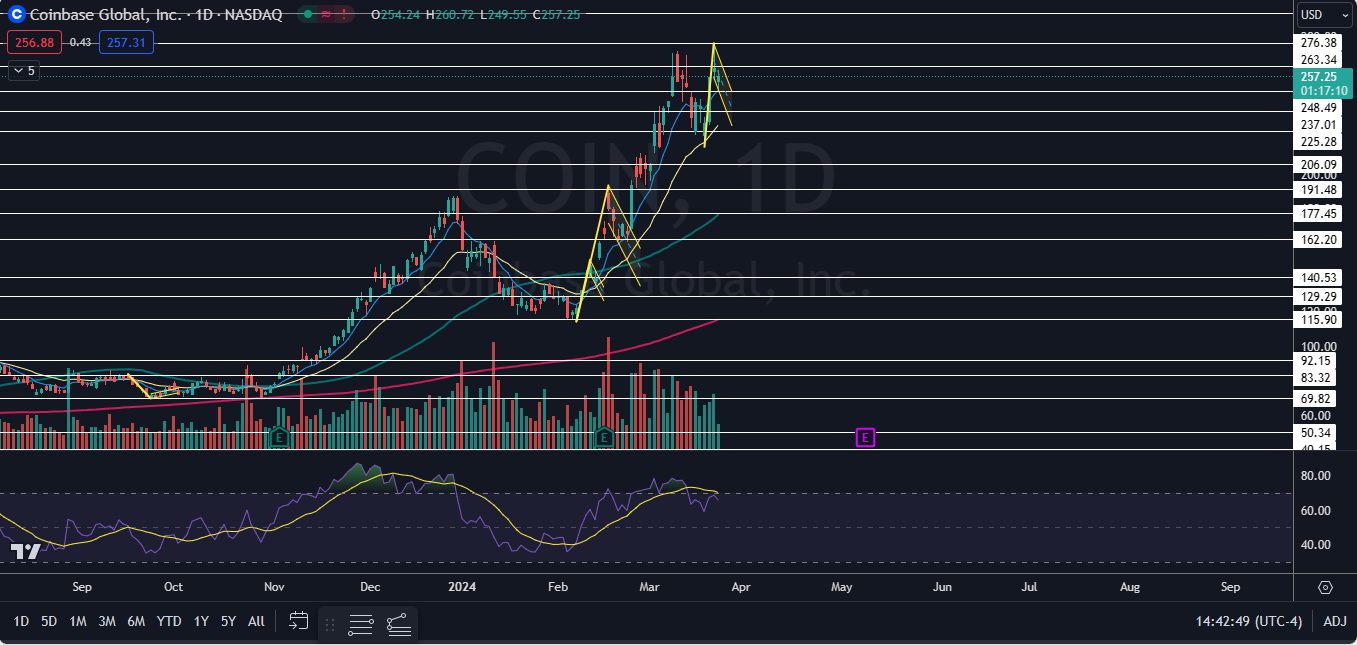
The Coinbase Chart: Coinbase was consolidating Friday on lower-than-average volume, working to print a doji candlestick on the daily chart. The doji candlestick indicates the local bottom may be in and if the candlestick is recognized, Coinbase may rebound on Monday.
- Friday’s consolidation, paired with the 27% surge between Tuesday and Thursday, has settled the stock into a possible bull flag pattern on the daily chart. If the formation is recognized and Coinbase eventually breaks up from the flag on higher-than-average volume, the measured move indicates the stock could trade up toward the $318 mark in the future.
- Coinbase negated its brief downtrend on Thursday by forming a higher high above the most recent higher low, which was printed on March 13 at $269.39. If Coinbase trades higher next week and breaks up from the bull flag, Friday’s low-of-day will serve as a higher low, which will confirm a new uptrend.
- Bullish traders want to see big bullish volume come in and push Coinbase up above Thursday’s high-of-day to confirm the bull flag and a new uptrend. Bears want to see big bearish volume come in and drop Coinabase down under the eight-day exponential moving average, which would negate the bull flag and possibly accelerate downside pressure.
- Coinbase has resistance above at $263.34 and at $276.38 and support below at $248.49 and at $237.01.
Featured photo sourced from Shutterstock
Posted In: $BTC $ETH ARKK COIN SARK TARK