Roku recently expanded its partnership with Cross Screen Media. The partnership would now enable agencies to measure spend accurately on Roku inventory, and leverage its Ad Platform for targeted advertising across linear TV and CTV.
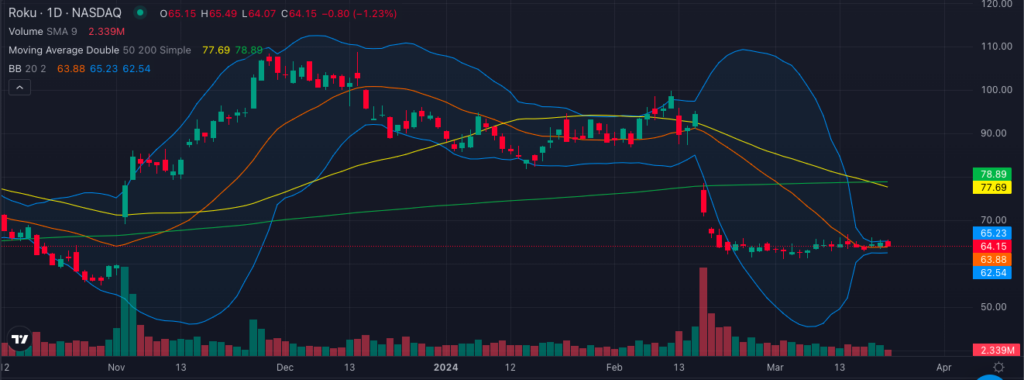
Additionally, the Bollinger Bands appear to be in a squeeze. A Bollinger band squeeze is typically triggered when volatility reaches a six-month low, and the Bollinger Bands reach a six-month minimum distance apart (more visible in the previous chart). When the bands squeeze together, the reflect reduced volatility and a potential for a breakout.
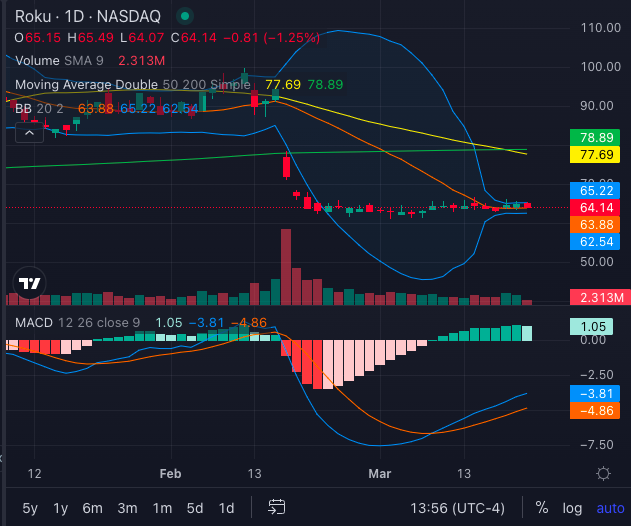
Indicators, such as the Relative Strength Index (RSI) suggest oversold conditions. The Moving Average Convergence Divergence (MACD) is above 1 and one can see the MACD line (blue) crossing over the Signal line (orange line), indicating potential bullish movement – almost conferring to the Bollinger Bands’ squeeze.
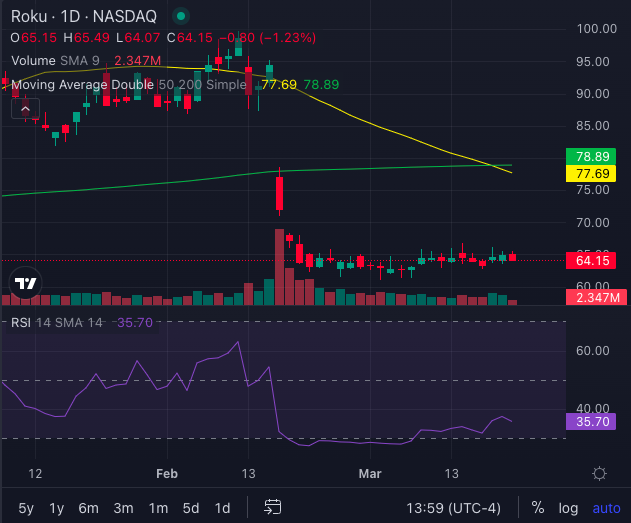
Is A Potential Breakout In The Cards?
When a Death Cross and a Bollinger Band Squeeze occur together, it generally indicates heightened potential for a significant price move. The Death Cross signals a bearish trend reversal, while the Bollinger Band Squeeze suggests a period of low volatility preceding a potential breakout.
This combination suggests increased uncertainty in the market and the potential for a substantial price swing, either to the downside or the upside, depending on other factors influencing the stock.
Traders may interpret this as a signal to exercise caution and closely monitor price movements for potential trading opportunities.
As Roku stock teeters on the brink of a Death Cross amid a Bollinger Band Squeeze, investors may want to closely monitor price movements for potential trading opportunities.