Stock Market Momo Crowd Wants The Fed To Bow To Them, What Happens To The Stock Market If The Fed Disappoints?
Author: The Arora Report | March 20, 2024 11:32am
To gain an edge, this is what you need to know today.

Fed Quandary
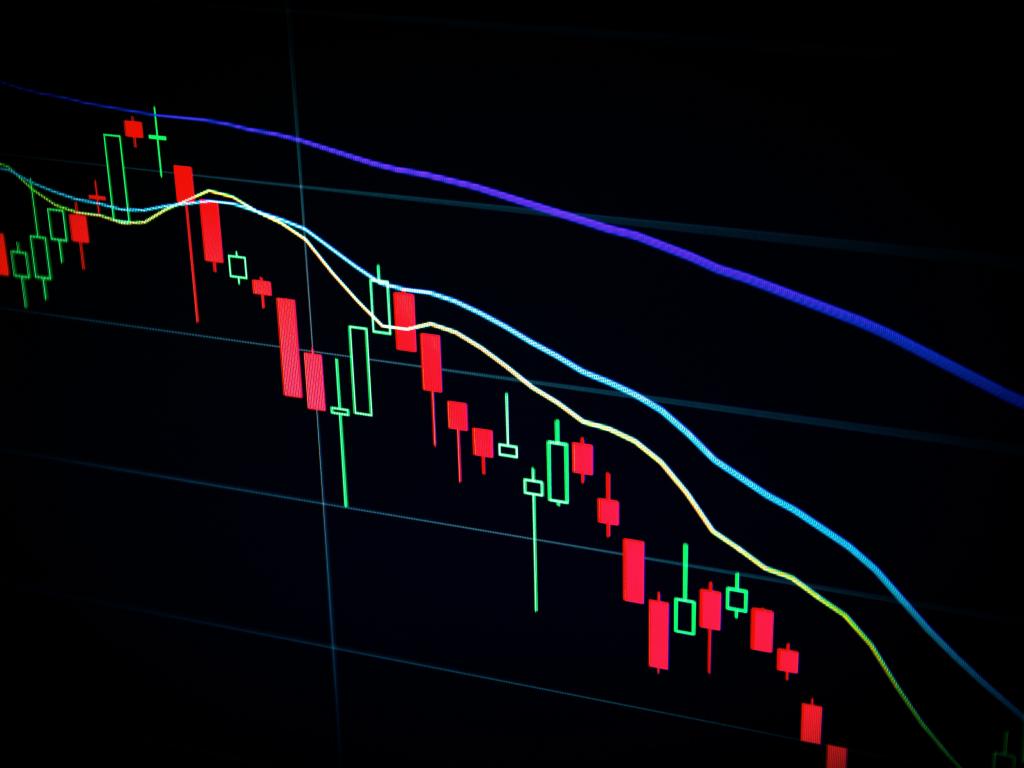
Please click here for an enlarged version of the chart of SPDR S&P 500 ETF Trust (NYSE:SPY) which represents the benchmark stock market index S&P 500 (SPX).
Note the following:
- The chart is a weekly chart to give investors a longer term perspective.
- The chart shows that the trendline is still intact.
- The momo crowd is going to continue to buy unless there is a sustained breakdown below the trendline for more than one week.
- The chart shows two weekly dojis. The doji is a candle pattern where opening and closing prices are very close to each other. A doji pattern indicates indecision. The chart shows two weeks of indecision.
- The latest candle shown on the chart is only for a partial week as of this writing. The Fed decision later today will determine how the candle for this week develops.
- The two weekly dojis are instructive in that the general belief is that the stock market is running up, but the two dojis on the chart say otherwise.
- The FOMC statement will be released at 2pm ET today followed by Powell’s press conference at 2:30pm ET.
- The momo crowd has continued to aggressively buy stocks. The momo gurus want the Fed to bow to them and start cutting rates, or at a minimum clearly indicate that rate cuts are coming soon.
- Prudent investors need to understand that the Fed and momo gurus have very different objectives.
- The momo gurus’ sole objective is to run up the stock market in the short term in the disguise of analysis.
- The Fed has a dual mandate – price stability and maximum employment.
- The Fed is concerned about the long term economy of the entire U.S. Momo gurus are only concerned about the stock market in the short term.
- The Fed faces several problems:
- The last two CPI numbers and the last PPI number were hotter than expected. The data shows that inflation is not coming down as the Fed had hoped.
- The economy is staying stronger than the Fed had hoped in view of high interest rates.
- Financial conditions have become easier in spite of the Fed keeping rates high.
- Easier financial conditions make it difficult to control inflation.
- Financial conditions have become easier than expected for three reasons.
- The stock market has gone up, generating a wealth effect.
- House prices are going up, generating wealth effect.
- The federal government continues to recklessly spend on a variety of programs and that spending is making financial conditions easier.
- It is like the Fed is pushing the brake pedal on the monetary side and the government is pushing the accelerator at the same time on the fiscal side.
- Here’s the key question for investors, “What happens to the stock market if the Fed decides to do the right thing?”
- In The Arora Report analysis, the right thing for the Fed to do is to keep interest rates high until financial conditions tighten or inflation data gets better or the economy weakens.
- The stock market is not prepared for the Fed to do the right thing. If the Fed decides to do the right thing, expect a pullback in the stock market. On the other hand, if the Fed decides to bow to the momo crowd, expect the rally to continue, potentially reaching 5400 in S&P 500.
- The guidance may change after the Fed meeting.
U.K.
U.K. data often precedes the U.S. data in the same direction. In the U.K., Consumer Price Index (CPI) came cooler than expected. Here are the details:
- Headline CPI came at 0.6% month-over-month vs. 0.7% consensus.
- Headline CPI came at 3.4% year-over-year vs. 3.5% consensus.
- Core CPI came at 0.6% month-over-month vs. 0.7% consensus.
- Core CPI came at 4.5% year-over-year vs. 4.6% consensus.
Magnificent Seven Money Flows
In the early trade, money flows are positive in Meta Platforms Inc (NASDAQ:META) and Tesla Inc (NASDAQ:TSLA).
In the early trade, money flows are neutral in Amazon.com, Inc. (NASDAQ:AMZN), Alphabet Inc Class C (NASDAQ:GOOG), Microsoft Corp (NASDAQ:MSFT), and NVIDIA Corp (NASDAQ:NVDA).
In the early trade, money flows are negative in Apple Inc (NASDAQ:AAPL).
In the early trade, money flows are mixed in SPDR S&P 500 ETF Trust (NYSE:SPY) and Invesco QQQ Trust Series 1 (NASDAQ:QQQ).
Momo Crowd And Smart Money In Stocks
The momo crowd is buying stocks in the early trade. Smart money is inactive in the early trade.
Gold
The momo crowd is inactive in the early trade. Smart money is inactive in the early trade.
For longer-term, please see gold and silver ratings.
The most popular ETF for gold is SPDR Gold Trust (NYSE:GLD). The most popular ETF for silver is iShares Silver Trust (NYSE:SLV).
Oil
API crude inventories came at a draw of 1.519M barrels vs. a consensus of a build of 0.077M barrels.
The momo crowd is selling oil in the early trade. Smart money is inactive in the early trade.
For longer-term, please see oil ratings.
The most popular ETF for oil is United States Oil ETF (NYSE:USO).
Bitcoin
Bitcoin (CRYPTO: BTC) is range bound.
Protection Band And What To Do Now
It is important for investors to look ahead and not in the rearview mirror.
Consider continuing to hold good, very long term, existing positions. Based on individual risk preference, consider a protection band consisting of cash or Treasury bills or short-term tactical trades as well as short to medium term hedges and short term hedges. This is a good way to protect yourself and participate in the upside at the same time.
You can determine your protection bands by adding cash to hedges. The high band of the protection is appropriate for those who are older or conservative. The low band of the protection is appropriate for those who are younger or aggressive. If you do not hedge, the total cash level should be more than stated above but significantly less than cash plus hedges.
It is worth reminding that you cannot take advantage of new upcoming opportunities if you are not holding enough cash. When adjusting hedge levels, consider adjusting partial stop quantities for stock positions (non ETF); consider using wider stops on remaining quantities and also allowing more room for high beta stocks. High beta stocks are the ones that move more than the market.
Traditional 60/40 Portfolio
Probability based risk reward adjusted for inflation does not favor long duration strategic bond allocation at this time.
Those who want to stick to traditional 60% allocation to stocks and 40% to bonds may consider focusing on only high quality bonds and bonds of seven year duration or less. Those willing to bring sophistication to their investing may consider using bond ETFs as tactical positions and not strategic positions at this time.
The Arora Report is known for its accurate calls. The Arora Report correctly called the big artificial intelligence rally before anyone else, the new bull market of 2023, the bear market of 2022, new stock market highs right after the virus low in 2020, the virus drop in 2020, the DJIA rally to 30,000 when it was trading at 16,000, the start of a mega bull market in 2009, and the financial crash of 2008. Please click here to sign up for a free forever Generate Wealth Newsletter.
This article is from an unpaid external contributor. It does not represent Benzinga's reporting and has not been edited for content or accuracy.
Posted In: $BTC AAPL AMZN GLD GOOG META MSFT NVDA QQQ SLV SPY TSLA USO