Bearish On Disruptive Innovation? Actively Managed ETF Provides A Play For Traders To Short Cathie Wood's ARKK
Author: Melanie Schaffer | March 18, 2024 02:52pm
AXS Short Innovation Daily ETF (NASDAQ:SARK) was trading near flat on Monday, while the Cathie Wood-led ARKK Innovation ETF (NYSE:ARKK) was trading near Friday’s closing price.
ARKK, Wood’s flagship fund, has shown weak performance compared to the general market for the last few years, failing to trade above the April 22, 2022, high of $55. In contrast, the S&P 500 has risen about 17% since that same date.
SARK is an actively managed fund focused on shorting disruptive innovation by tracking its ETF counterpart, the AXS 2X Innovation ETF (NASDAQ:TARK) inversely.
Read Next: Cathie Wood's Ark Offloads $20M Of Soaring Robinhood, Pauses Selloff In This Crypto Play
Trending: Stocks Rally With Google, Tesla At The Helm, But Rising Oil Prices Spark Inflation Fears: What's Driving Markets Monday?
For traders bullish on ARKK, AXS 2X Innovation ETF is an actively managed fund aiming to return 200% of the daily performance of ARKK.
For more advanced traders, SARK and TARK offer traders the ability to trade with more leverage through options.
Want direct analysis? Find me in the BZ Pro lounge! Click here for a free trial.
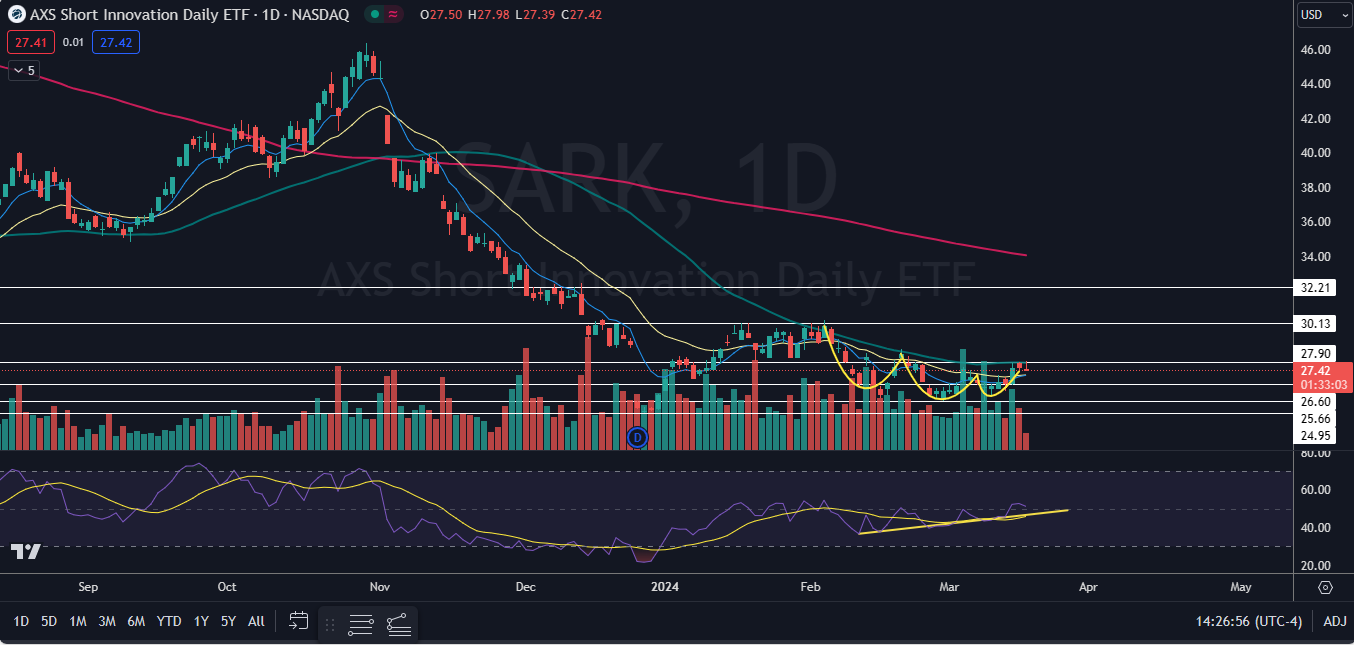
The SARK Chart: SARK has been trading mostly sideways between about $25 and $30 since Dec. 14. Between Feb. 5 and Monday, the ETF has formed a possible inverted head-and-shoulder pattern between that trading range, indicating a move to the upside could be on the horizon.
- The inverted left shoulder was created between Feb. 5 and Feb. 21, the inverted head was formed between Feb,. 22 and March 7 and the right inverted shoulder has formed since then. The measured move, if the pattern is recognized and SARK breaks up above $27.90 on higher-than-average volume is about 7.5%, indicating the ETF could rise up toward about the $30 mark, which is likely to act as strong resistance.
- Mild bullish divergence has also developed on SARK’s chart, with the ETF making a series of lower lows while it’s ETF has made a series of higher lows. For the divergence to correct, SARK will either need to trade higher or momentum in the ETF will need to decrease over time.
- Bullish traders want to see SARK break up above the $27.90 area on high volume, which would indicate the inverted head-and-shoulder pattern was recognized. Bearish traders want to see big bearish volume come in and drop SARK under 25.48, which could accelerate downside pressure and cause the ETF to fall into a downtrend.
- SARK has resistance above at $27.90 and at $30.13 and support below at $26.60 and at $25.66.Featru
Featured image sourced from Shutterstock
Posted In: ARKK SARK TARK