Cannabis Chart Of The Week: The Market Reacted Rationally (For A Change) To 4th Qtr 2023 Earnings Releases
Author: Viridian Capital Advisors | March 18, 2024 12:46pm
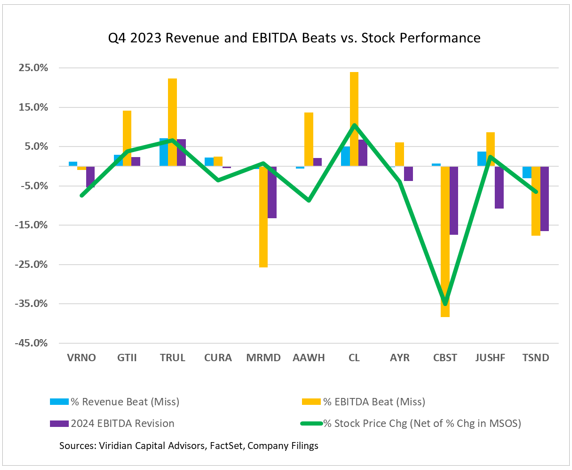
Earnings for the 4th quarter of 2023 have largely been released, and the results were generally positive, with a few exceptions. Unlike what we expected, the market reacted rationally to the EBITDA beats with a statistically significant .75 correlation between EBITDA surprises and stock performance.
-
The graph shows the % revenue beat (blue bar), the % EBITDA beat) (yellow bar), and the percent revision to 2024 EBITDA estimates (purple bar). The green line shows the net percent change in the company’s stock price from two days before the release to two days after the release after subtracting the change in the MSOS ETF for the same period.
-
The companies on the graph beat aggregate revenue estimates by 1.05% and EBITDA estimates by 7.07%.
-
Standout EBITDA beats included:
-
Green Thumb (OTC:GTBIF) beat EBITDA estimates by 14% due to continued strength in Maryland, driving better performance in the company’s retail segment.
-
Trulieve (OTC:TCNNF) beat EBITDA estimates by 22.3%, citing firm SG&A cost control and gross margin improvements from lower production costs and reduced pressures from inventory reduction efforts.
-
However, there were also several significant EBITDA misses:
-
Marimed (OTC:MRMD) missed its EBITDA estimates by around 25%, blaming the shortfall on construction delays caused by supply chain issues. The company is guiding to revenue growth of 5-7% and EBITDA growth of 0-2%, implying margin contraction. Analysts took their 2024 EBITDA estimates down by 13% but remain modestly above the company guidance.
-
Cannabist (OTC:CBSTF) missed consensus EBITDA estimates by approximately 38%, blaming the shortfall on around 5% margin contraction from discounts taken to reduce excess inventories. Cannabist also mentioned that underutilization of facilities caused a similar reduction in margins. Analysts reduced 2024 EBITDA estimates by 17% on the somewhat downbeat outlook for the year, concentrating on increasing cash flow and improving the balance sheet. Cannsbist stock was down nearly 21%, while the MSOS increased by 14.5%.
-
TerrAscend (OTC:TRSSF) missed EBITDA estimates by 17.6%, mainly due to cultivation issues in Maryland, including a crop failure. The company guided to lower margins in Q1, and analysts reduced full-year 2024 EBITDA estimates by 16.5%
-
Analysts revised their 2024 EBITDA estimates for the group downward by approximately 1%, virtually all related to lower revenue growth. Estimates now call for 3.8% revenue growth and EBITDA margin expansion from 24.8% to 25.9%. Viridian believes there is solid potential for higher revenue growth and additional margin expansion.
The Viridian Capital Chart of the Week highlights key investment, valuation and M&A trends taken from the Viridian Cannabis Deal Tracker.
The Viridian Cannabis Deal Tracker provides the market intelligence that cannabis companies, investors, and acquirers utilize to make informed decisions regarding capital allocation and M&A strategy. The Deal Tracker is a proprietary information service that monitors capital raise and M&A activity in the legal cannabis, CBD, and psychedelics industries. Each week the Tracker aggregates and analyzes all closed deals and segments each according to key metrics:
-
Deals by Industry Sector (To track the flow of capital and M&A Deals by one of 12 Sectors - from Cultivation to Brands to Software)
-
Deal Structure (Equity/Debt for Capital Raises, Cash/Stock/Earnout for M&A) Status of the company announcing the transaction (Public vs. Private)
-
Principals to the Transaction (Issuer/Investor/Lender/Acquirer) Key deal terms (Pricing and Valuation)
-
Key Deal Terms (Deal Size, Valuation, Pricing, Warrants, Cost of Capital)
-
Deals by Location of Issuer/Buyer/Seller (To Track the Flow of Capital and M&A Deals by State and Country)
-
Credit Ratings (Leverage and Liquidity Ratios)
Since its inception in 2015, the Viridian Cannabis Deal Tracker has tracked and analyzed more than 2,500 capital raises and 1,000 M&A transactions totaling over $50 billion in aggregate value.
The preceding article is from one of our external contributors. It does not represent the opinion of Benzinga and has not been edited.
Posted In: CBSTF GTBIF MRMD TCNNF TRSSF